6B · Introduction to Heart Anatomy
This lecture covers the structures of the heart you need to make sense of cardiac electrophysiology.
Chambers and blood flow
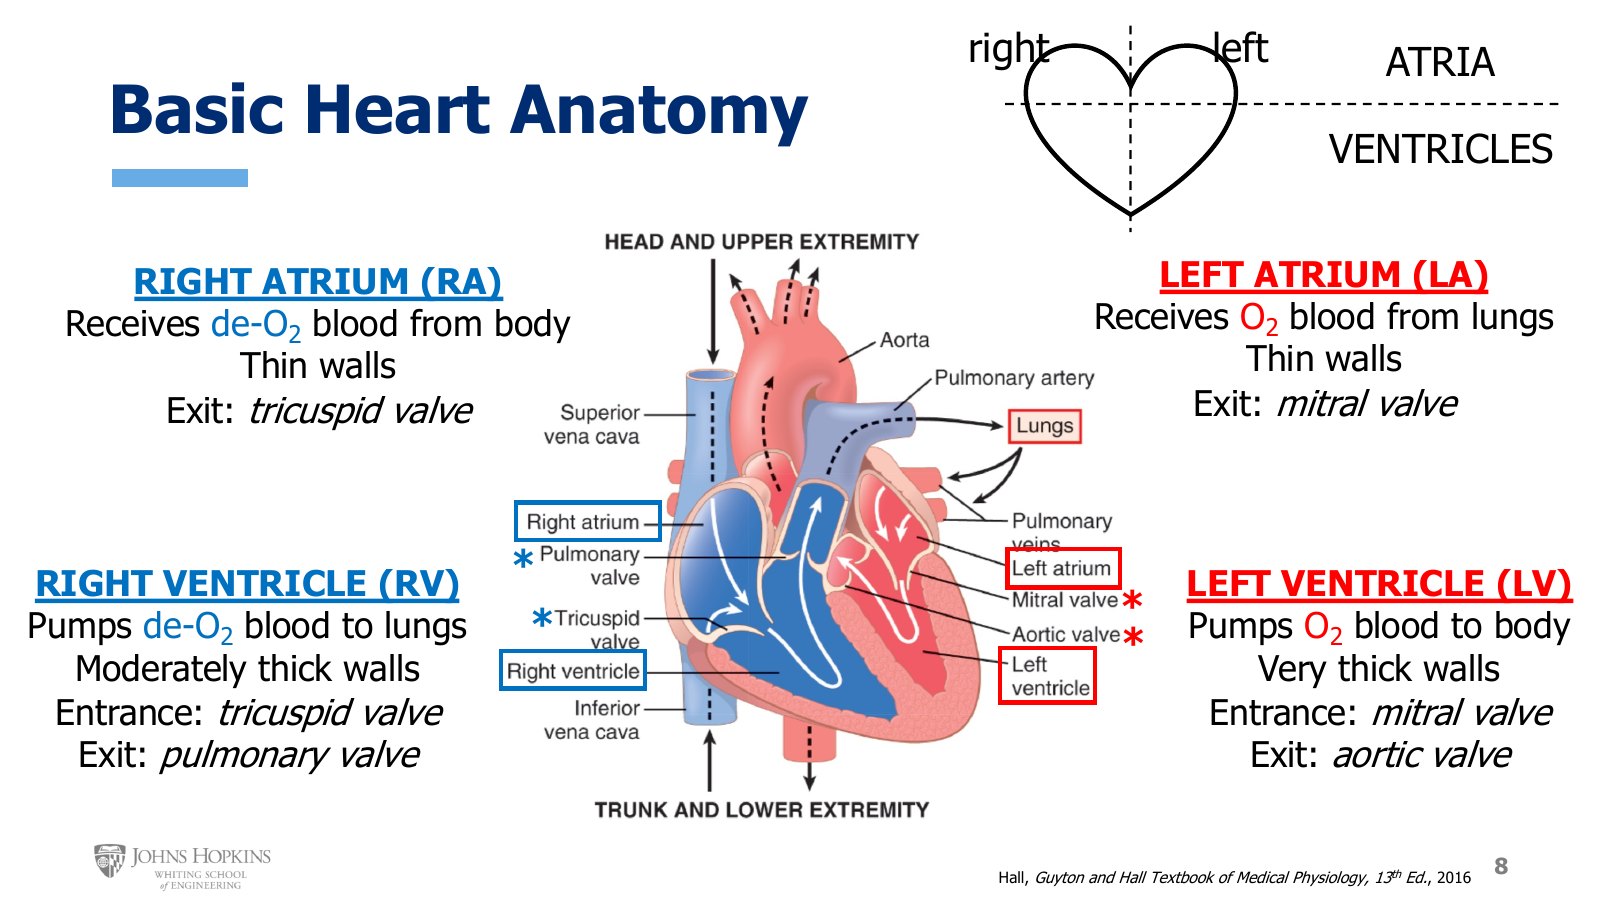
Slide 8. The four chambers with their walls, inputs, and valves. The small sketch at top right shows the vertical and horizontal dividing lines and that left and right are the patient’s.
The heart is divided into four chambers along vertical and horizontal lines. The top two chambers are the atria. The bottom two are the ventricles. The chambers on the left side of most drawings are labeled as the right side of the heart, because you are looking at the heart as it sits in someone else’s chest. Left and right refer to the patient’s left and right, not the observer’s. So the chambers on the left of the diagram are the right side of the heart, and the chambers on the right of the diagram are the left side.
The larger image shows the blue right side, the red left side, the atria up top, the ventricles below, and an arrow for the direction of blood flow.
Right atrium. Receives deoxygenated blue blood from the head and upper body and from the trunk and lower body. Blood enters this thin-walled collecting chamber and leaves out the bottom through the tricuspid valve, which controls movement of blood from the right atrium into the right ventricle. The walls are quite thin because they only need to squeeze blood a very short distance across the valve and into the ventricle.
Right ventricle. Moderately thick walls, because it needs a little more muscle to pump blood a little farther, out to the lungs for oxygenation. Blood leaves through the pulmonary valve.
Left atrium. Once blood has been oxygenated in the lungs, now bright red, it collects in the thin-walled left atrium and is pumped through the mitral valve down into the left ventricle.
Left ventricle. Very thick walls, because its job is to pump blood out through the aortic valve to the far reaches of the body, supplying every cell with oxygen and still having enough pressure to return to the right atrium.
Three kinds of heart tissue
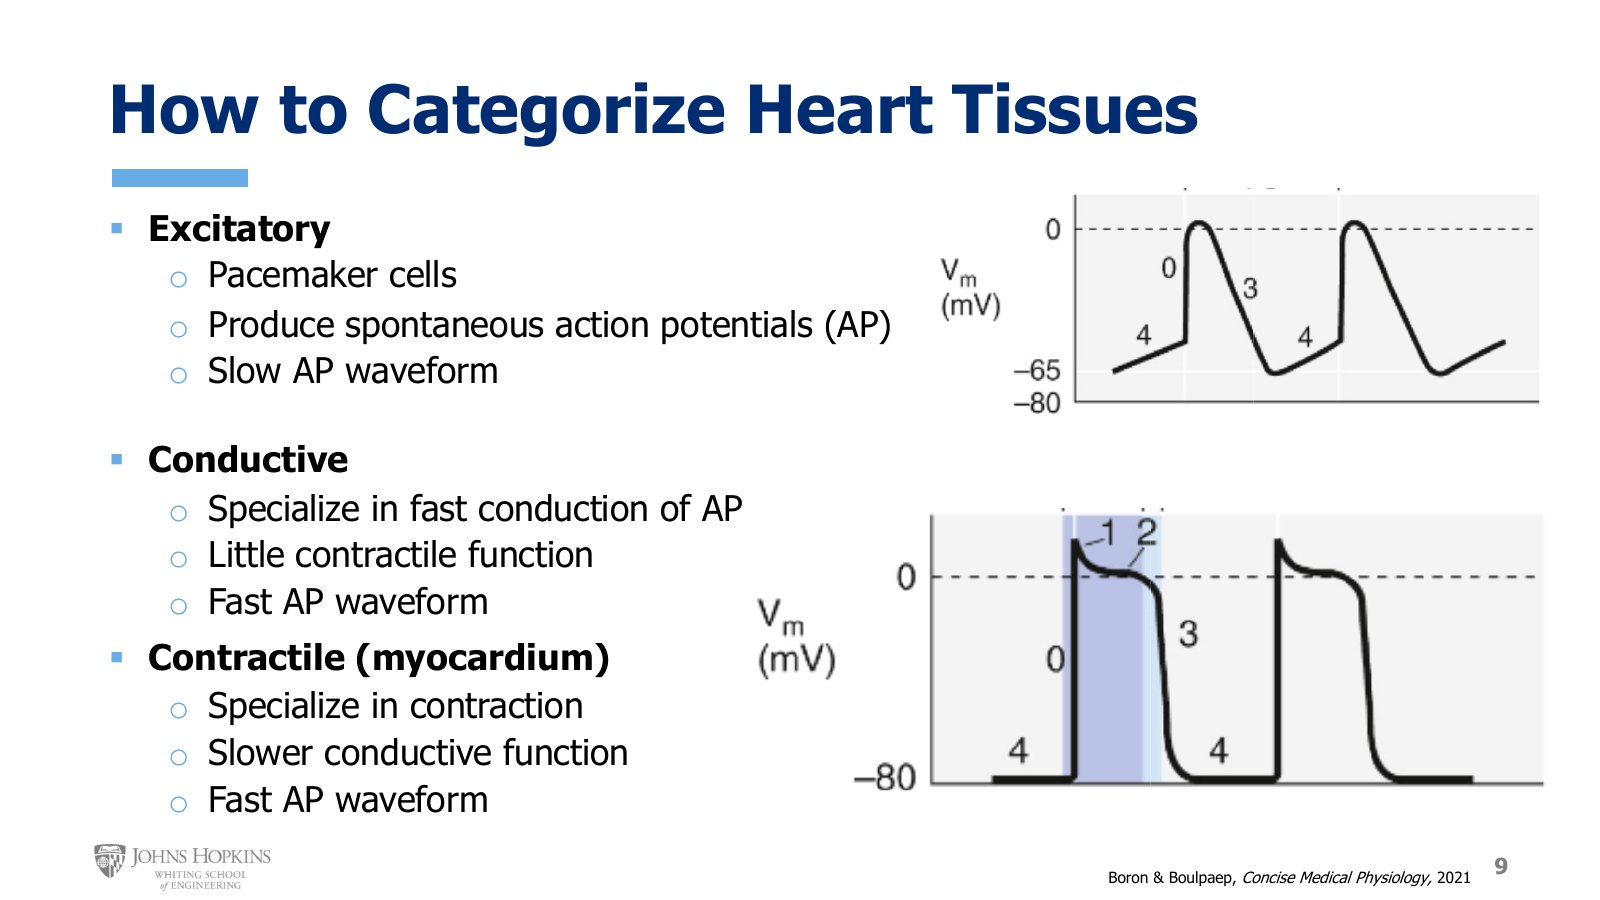
Slide 9. Excitatory tissue shows the slow waveform with a sloping phase 4. Conductive and contractile tissue show the fast waveform with a flat phase 4.
Different regions of the heart play different roles in electrical excitation and mechanical contraction.
Excitatory tissue. These are the pacemaker cells. Their job is to spontaneously depolarize and produce action potentials at predictable, regular intervals, producing the excitatory waves of depolarization that spread through the whole heart. They show their own unique waveform, the slow response action potential, which gets a full lecture of its own (6C).
Conductive tissue. Does not initiate action potentials. It specializes in conducting them through gap junctions, transmitting them incredibly quickly. It is very good at electrical conduction but has little, if any, contractile function.
Contractile tissue. Cardiac muscle, the myocardium. It specializes in contraction and is not as good at conduction, passing action potentials more slowly from cell to cell.
Both conductive and contractile tissue show the waveform briefly examined in the study of cardiac muscle. It is called the fast response action potential, and it also gets a full lecture (6D).
Following the action potential through the heart
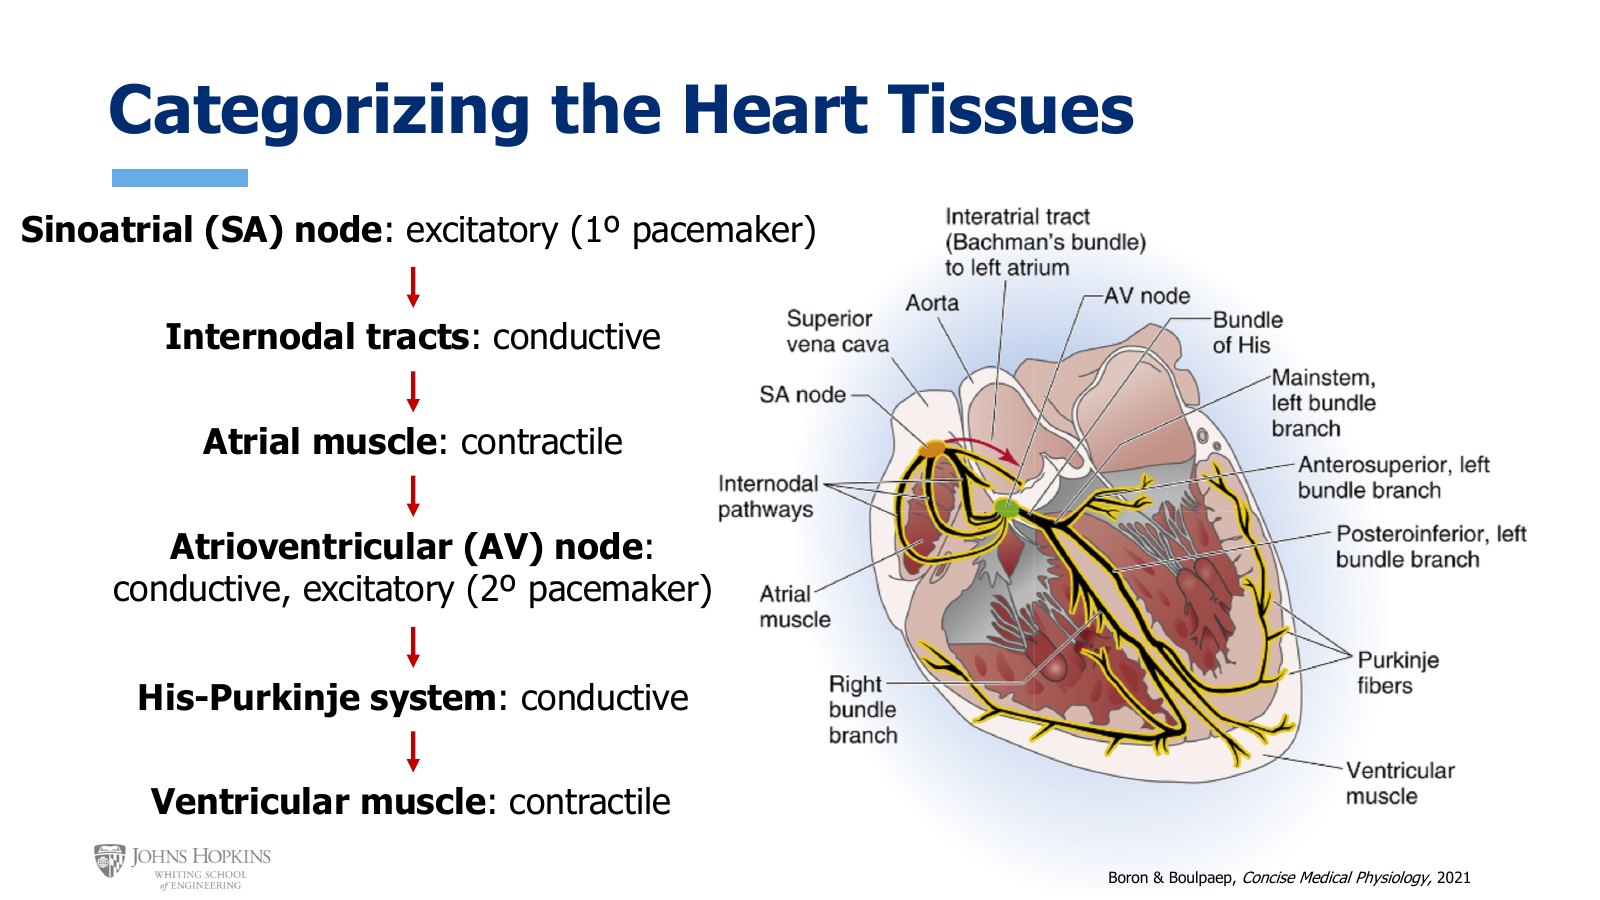
Slide 10. The sequence SA node, internodal tracts, atrial muscle, AV node, His-Purkinje system, ventricular muscle, with each region’s role. The drawing labels the internodal pathways, the interatrial tract (Bachman’s bundle), and the left bundle branch divisions.
Sinoatrial (SA) node. The action potential originates at the top of the right atrium in a small bundle of excitatory cells, the sinoatrial node. It is the regular, day-to-day primary pacemaker of the heart.
Internodal tracts. Conductive tissue of the atria, carrying the action potential to the atrial muscle.
Atrial muscle. Contractile cells, stimulated to contract.
Atrioventricular (AV) node. After traveling down through the internodal tracts and atrial muscle, the action potential collects and coalesces at the atrioventricular node, another small patch of cells at the lower corner of the right atrium, right next to the septum that divides it from the left atrium. Its regular job is conductive: collect the action potential, delay it for about a tenth of a second, then pass it to the bottom portion of the heart. If the SA node does not work properly, or the action potential gets hung up somewhere in the atrial tissue and does not reach the AV node on time, the AV node has excitatory properties and can take over as a secondary pacemaker in a pinch.
His-Purkinje system. An expansive conduction system carrying the action potential through the bottom half of the heart. It starts as the bundle of His, which splits into right and left bundle branches carrying the action potential to the pointy bottom, the apex. At the apex they branch further into tentacle-like Purkinje fibers that move up the ventricular walls.
Ventricular muscle. The Purkinje fibers terminate on the ventricular muscle, transferring the signal to the final contractile tissue.
Waveforms and conduction velocity by region
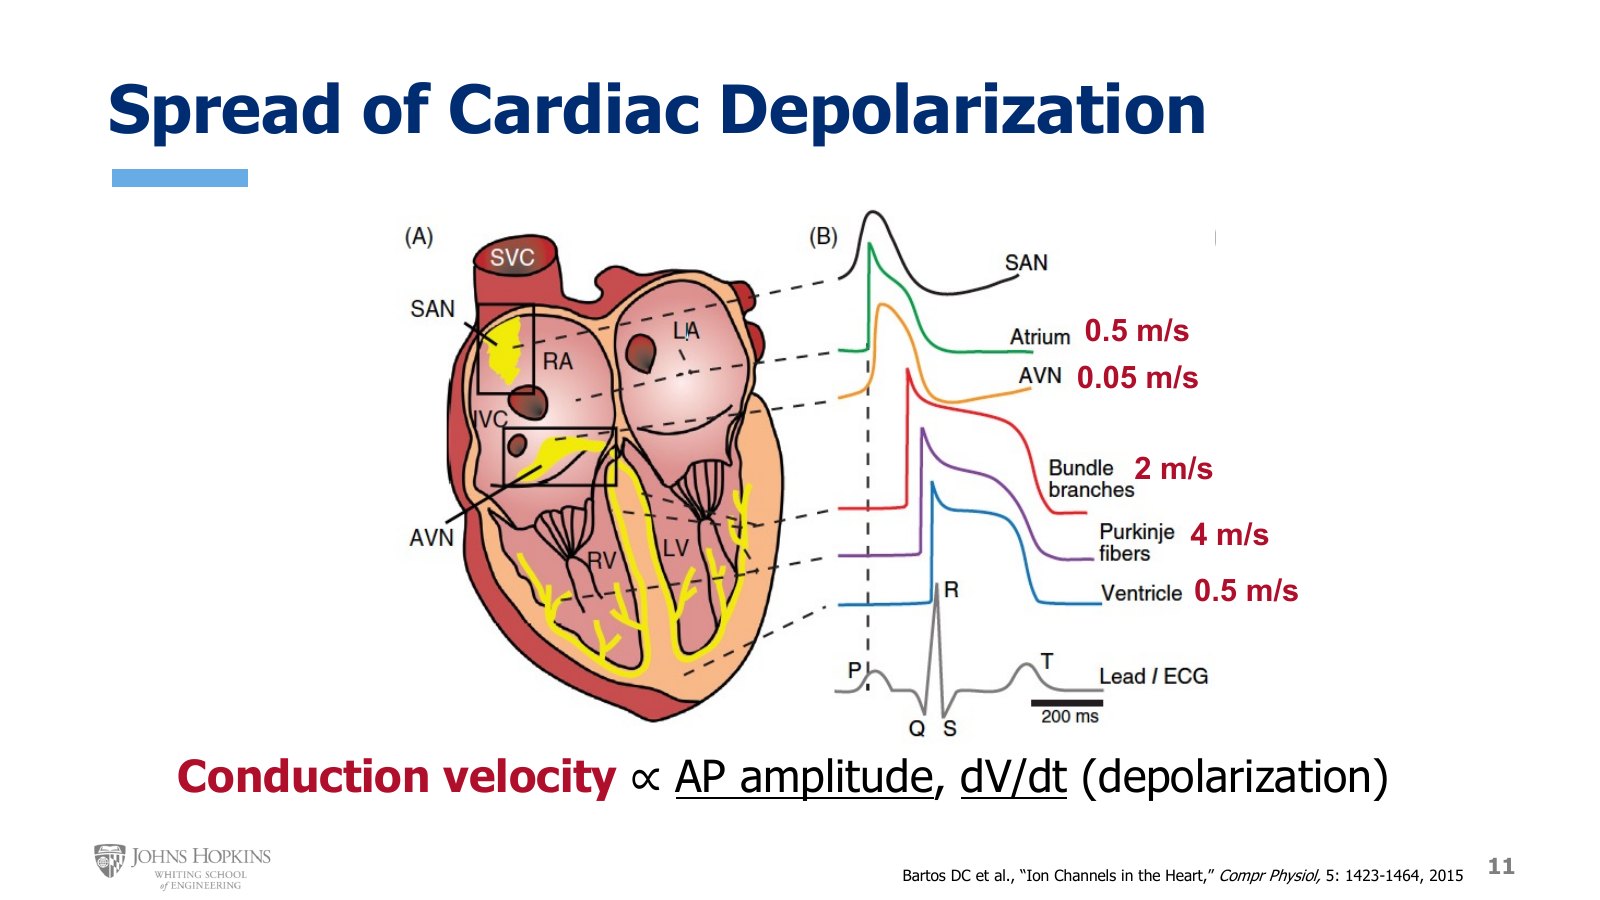
Slide 11. Each region’s action potential, triggered in sequence, with conduction velocities: atrium 0.5, AV node 0.05, bundle branches 2, Purkinje fibers 4, ventricle 0.5 m/s. The ECG runs along the bottom.
Each major region has an emblematic waveform, and you can watch them trigger in sequence as the action potential moves from region to region. This figure does not include the internodal pathways.
SA node. A classic slow response waveform: a gradual upstroke during depolarization, repolarization, and a resting phase with a gentle upward slope of its own. These are all hallmarks of the slow action potential.
Atrial muscle. A fast response waveform: an almost vertical upstroke during depolarization, a plateau (a bit droopy here), then repolarization. The resting phase is a true resting phase, completely flat. Conduction velocity is about 0.5 m/s.
AV node. Also a slow action potential. Its major job is to delay transmission for about a tenth of a second, so conduction is quite slow: about 0.05 m/s, ten times slower than through atrial muscle.
Bundle branches and Purkinje fibers. Both fast response, with the much faster conduction expected of conductive tissue: about 2 m/s in the bundle branches and about 4 m/s in the Purkinje fibers.
Ventricular myocardium. Fast response. Conducts from cell to cell at about 0.5 m/s, very similar to atrial muscle and significantly slower than the His-Purkinje system.
What determines conduction velocity
Two properties of the action potential waveform set conduction velocity through a region.
Amplitude, from very bottom to very top, which indicates how many positive charges are entering the cell.
dV/dt of the phase 0 upstroke, which indicates how quickly positive charges are entering the cell.
Both the number of positive ions entering and the rate at which they enter determine how quickly those ions diffuse through gap junctions to the cell next door, bringing it up to threshold and depolarizing it.