6E · Introduction to the Electrocardiogram (ECG)
From single cells to the whole heart
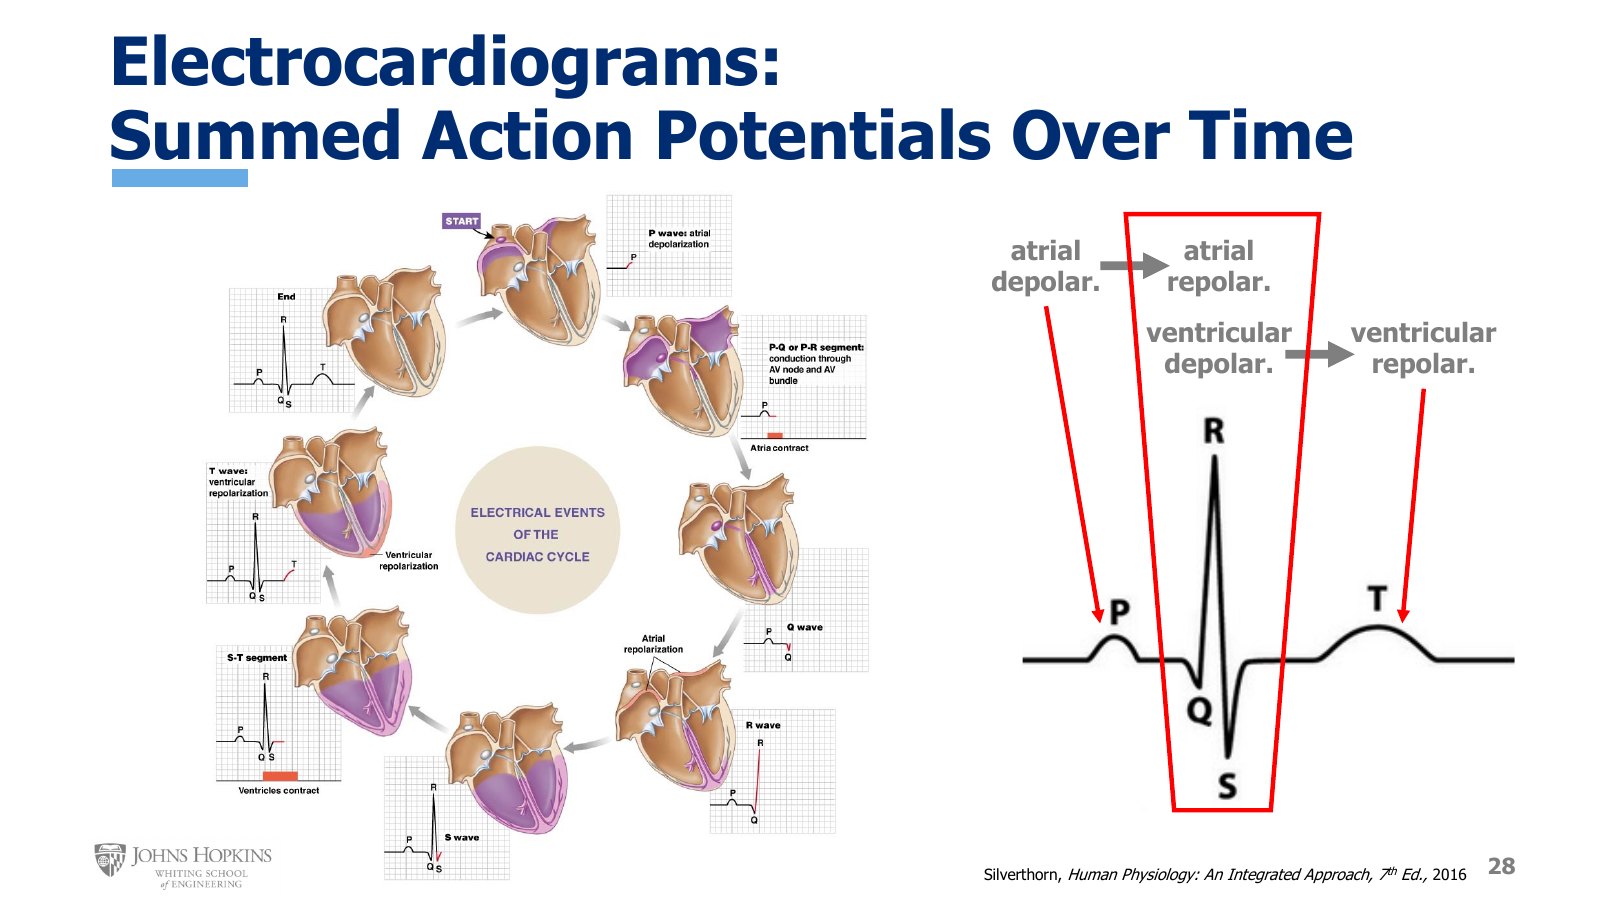
Slide 28. The electrical events of the cardiac cycle traced around the heart, beside a bare-bones ECG. The red box marks the QRS complex, where atrial repolarization and ventricular depolarization overlap.
Understanding the electrocardiogram (ECG) means shifting attention from features of individual action potentials in individual cells, a very microscopic focus, to waves of depolarization sweeping through the very macroscopic tissues of the heart. From a zoomed-out perspective, the top of the atria depolarizes first, and depolarization spreads down through the walls of both atria. Then the AV node depolarizes, passing the wave into the bottom half of the heart: first the His-Purkinje system, then up through the walls of both ventricles.
The atria and ventricles have enough mass that when all their cells depolarize, the electrical event is big enough to be detected outside the body. That is the electrocardiogram. Electrodes attached to the skin of the chest capture a three-dimensional view of the electrical signals from the heart as it conducts: first a wave of depolarization, then a wave of repolarization.
A bare-bones classic ECG has three deflections, each matching a specific electrical event as the signal travels from top to bottom.
P wave. Atrial depolarization, which occurs first. It is essentially all of the individual atrial action potentials summing into a signal detectable outside the body.
QRS complex. Two events occurring simultaneously: atrial repolarization and ventricular depolarization. The ventricles contain so much more tissue than the atria that ventricular depolarization dominates. The much smaller atrial repolarization occurs here but gets lost in the ventricular signal.
T wave. Ventricular repolarization.
Fully labeled ECG
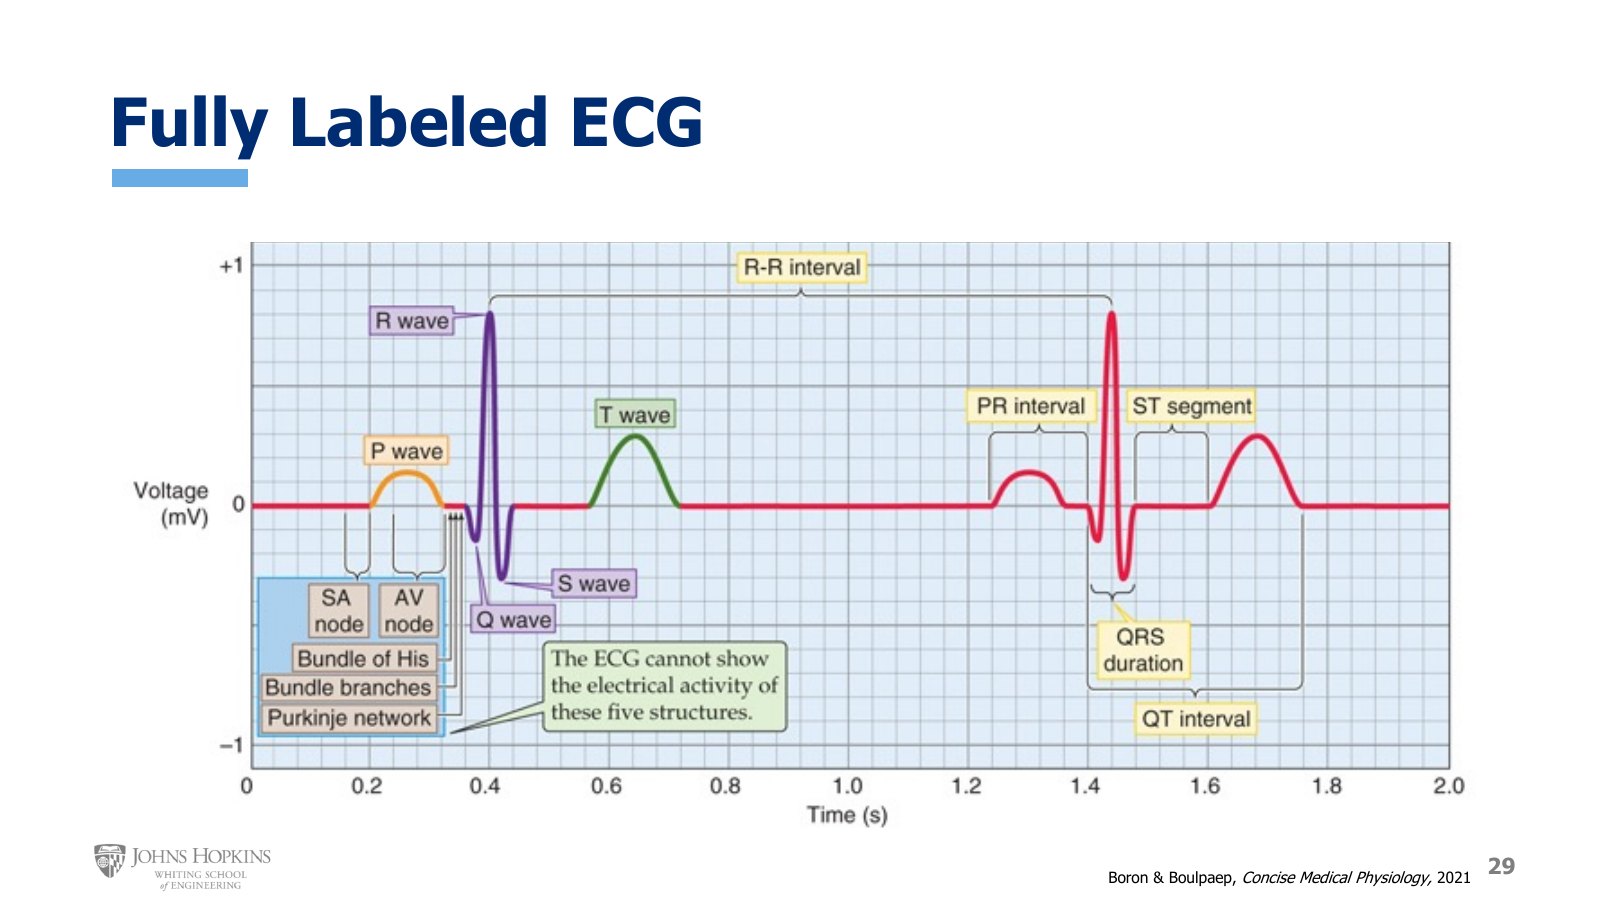
Slide 29. A fully labeled ECG: P wave, Q, R, and S waves, T wave, PR interval, ST segment, QRS duration, QT interval, and R-R interval. The box notes the ECG cannot show the SA node, AV node, bundle of His, bundle branches, or Purkinje network.
Considering all the electrical events of the heart, not just atria and ventricles, you can mentally superimpose where the excitatory and conductive events fall on the ECG.
The SA node depolarizes just before the atria. The area of tissue is so small that it does not show up; you simply know this is when it occurs.
The atria depolarize in the P wave.
The AV node gathers the action potential coming from the atria and very slowly passes it along during the second half of the P wave. Again, AV node tissue is too small to show up as a separate waveform; you are projecting when it would happen.
The short flat PR segment is the time the action potential spends traveling through the His-Purkinje system before full-blown ventricular depolarization in the QRS complex.
Then ventricular repolarization in the T wave.
So changes in conduction velocity through the atria, the AV node, the His-Purkinje system, or the ventricles show up as changes in the duration, or width, of the P wave, the PR segment, or the QRS complex.
Micro against macro signals
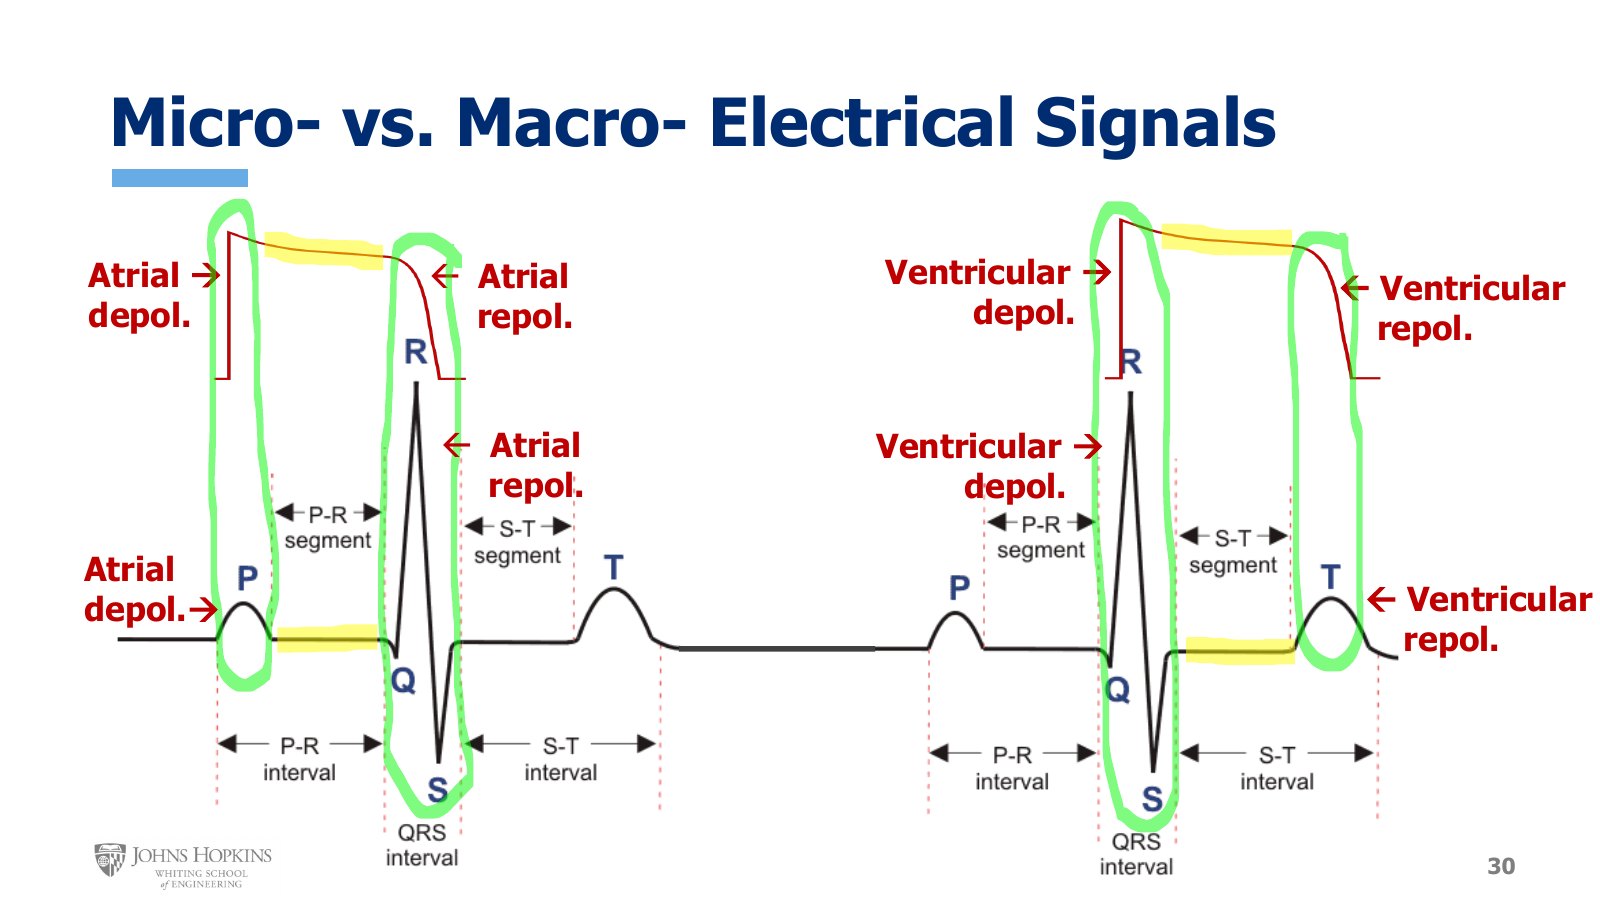
Slide 30. Two heartbeats. Over the first, an atrial action potential aligned with the P wave and QRS. Over the second, a ventricular action potential aligned with the QRS and T wave. The plateaus line up with the PR and ST segments.
One more view marries the macroscopic events of the ECG to the microscopic events of the cellular action potential. Two ECG waveforms, two heartbeats in sequence, are used only because doing it all on one gets too crowded.
Atrial, first beat. The P wave is depolarization of atrial tissue and the QRS complex contains repolarization of atrial tissue. Phase 0 of the fast action potential is depolarization in an atrial cell, so phase 0 and the P wave occur at roughly the same time. Phase 3 is atrial repolarization, so phase 3 and the QRS complex occur at roughly the same time. The PR segment, then, reflects the duration of the atrial phase 2 plateau that separates depolarization from repolarization.
Ventricular, second beat. The QRS complex is depolarization of ventricular tissue and the T wave is repolarization of ventricular tissue. Phase 0 is ventricular depolarization, so phase 0 and the QRS complex occur at roughly the same time. Phase 3 is ventricular repolarization, so phase 3 and the T wave occur at roughly the same time. The ST segment, then, reflects the duration of ventricular phase 2 that separates depolarization from repolarization.
The 12-lead ECG
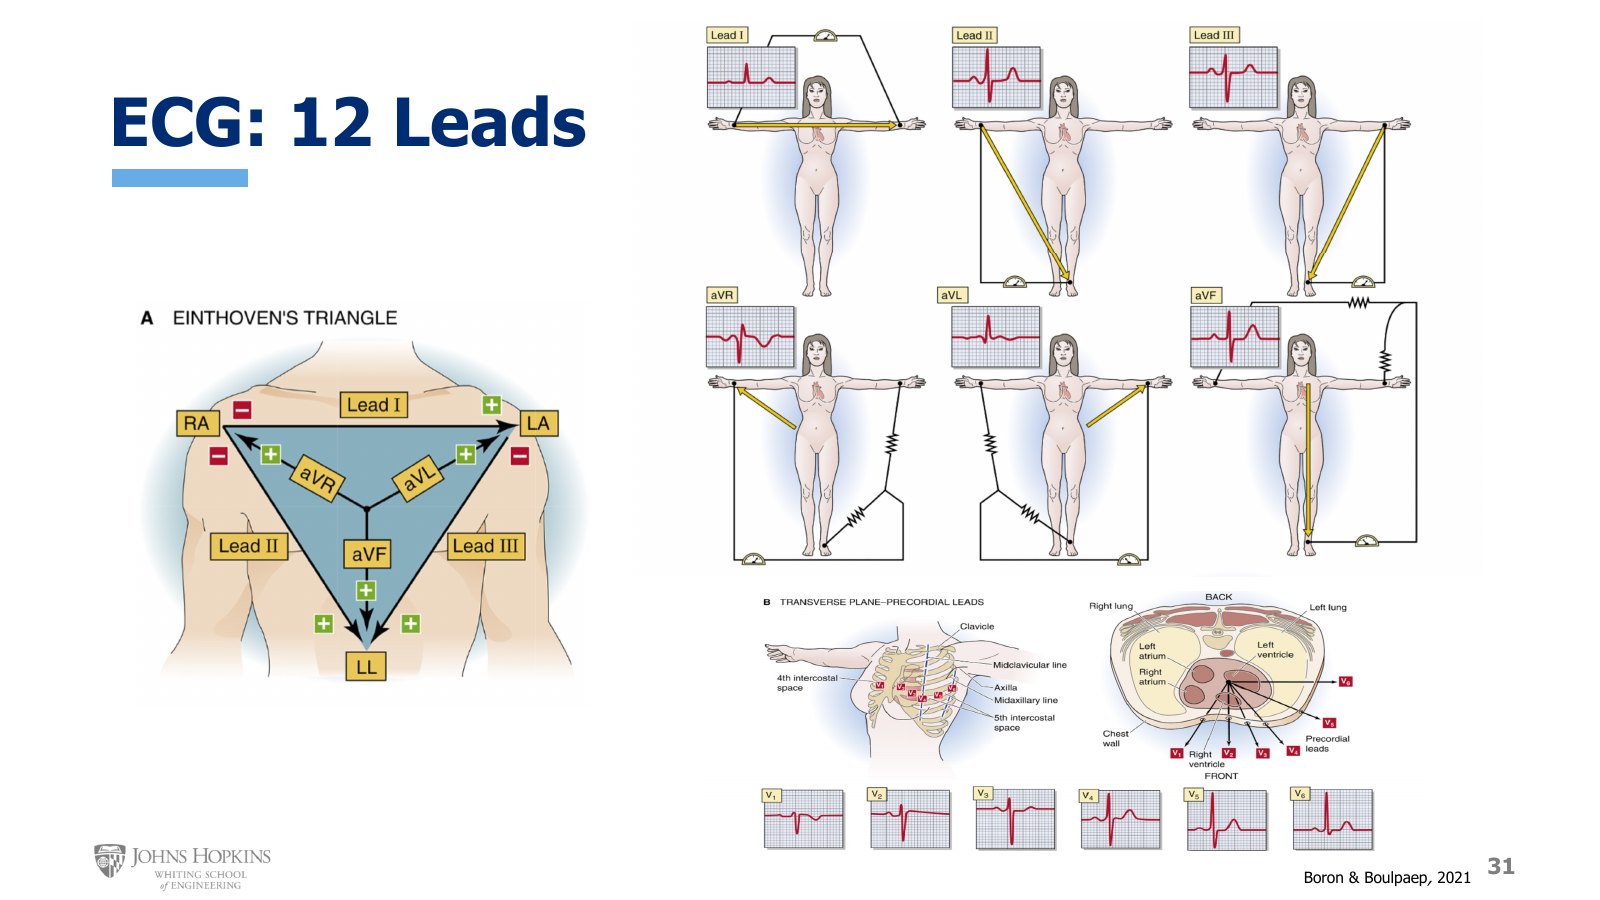
Slide 31. Einthoven’s triangle with leads I, II, III and the augmented leads aVR, aVL, aVF, each lead’s electrode connections, and the six precordial leads V1 to V6 in the transverse plane.
A full clinical ECG is a 12-lead ECG, eavesdropping on the heart’s electrical activity from different vantage points on the chest, in all three dimensions. A lead is created by connecting two electrodes to each other. Typically one electrode goes on the right arm, one on the left arm, one on the left leg, and six more across the rib cage.
Lead I: negative pole on the right arm to positive pole on the left arm.
Lead III: negative pole on the left arm to positive pole on the left leg.
Lead II: negative pole on the right arm to positive pole on the left leg.
Each lead gives information about electrical signals in the heart traveling in that particular direction. The signal on a lead is strongest when the electrical signal in the heart travels in line with that lead. The wave of depolarization tends to travel from the SA node in the upper left to the ventricles in the lower right on the chest as you look at it, mostly following the direction of lead II. So lead II tends to give the most pronounced, most iconic ECG waveform.
A simplified schematic of the triangle formed by leads I, II, and III has long been noted for its importance in modeling the direction of electrical propagation in the heart using vectorial analysis. It is Einthoven’s triangle, described in 1912 by Dr. Willem Einthoven, the Nobel Prize-winning Dutch doctor and physiologist who also invented the ECG back in 1895.
From these three primary, or standard limb leads, you can create calculated, or augmented limb leads.
aVR, augmented vector right: from the average location between the left arm and left leg (the calculated negative pole) to the right arm (positive pole).
aVL, augmented vector left: from the averaged position between the right arm and left leg (calculated negative pole) to the left arm (positive pole).
aVF, augmented vector foot: from the averaged location between the right arm and left arm (calculated negative pole) down to the left leg (positive pole).
Transferred onto Einthoven’s triangle, the augmented leads show the directional vectors from the center of the heart out to the three electrodes. These six limb leads, standard and augmented, give six directional leads in the frontal plane against which to compare the actual direction of electrical propagation across the chest.
For propagation from the back corner of the heart out to the side and front, the six electrodes on the rib cage give six precordial leads in the horizontal, or transverse plane. Each skin electrode is the positive connection for its lead, and the extrapolated, calculated center of the heart is the negative connection. The precordial leads, V1 through V6, give information about the direction of propagation from front to back and side to side, again with the strongest signals in the lead most closely following the path of propagation. Unless you are a clinical cardiologist you probably will not spend much time examining the precordial leads, but they are good to know about and understand at a general level.