6D · Fast-Response Cardiac Action Potential
This lecture covers the phases of the fast response action potential, the ionic currents and channels that create its unique waveform, and the tissues that show it.
Overview
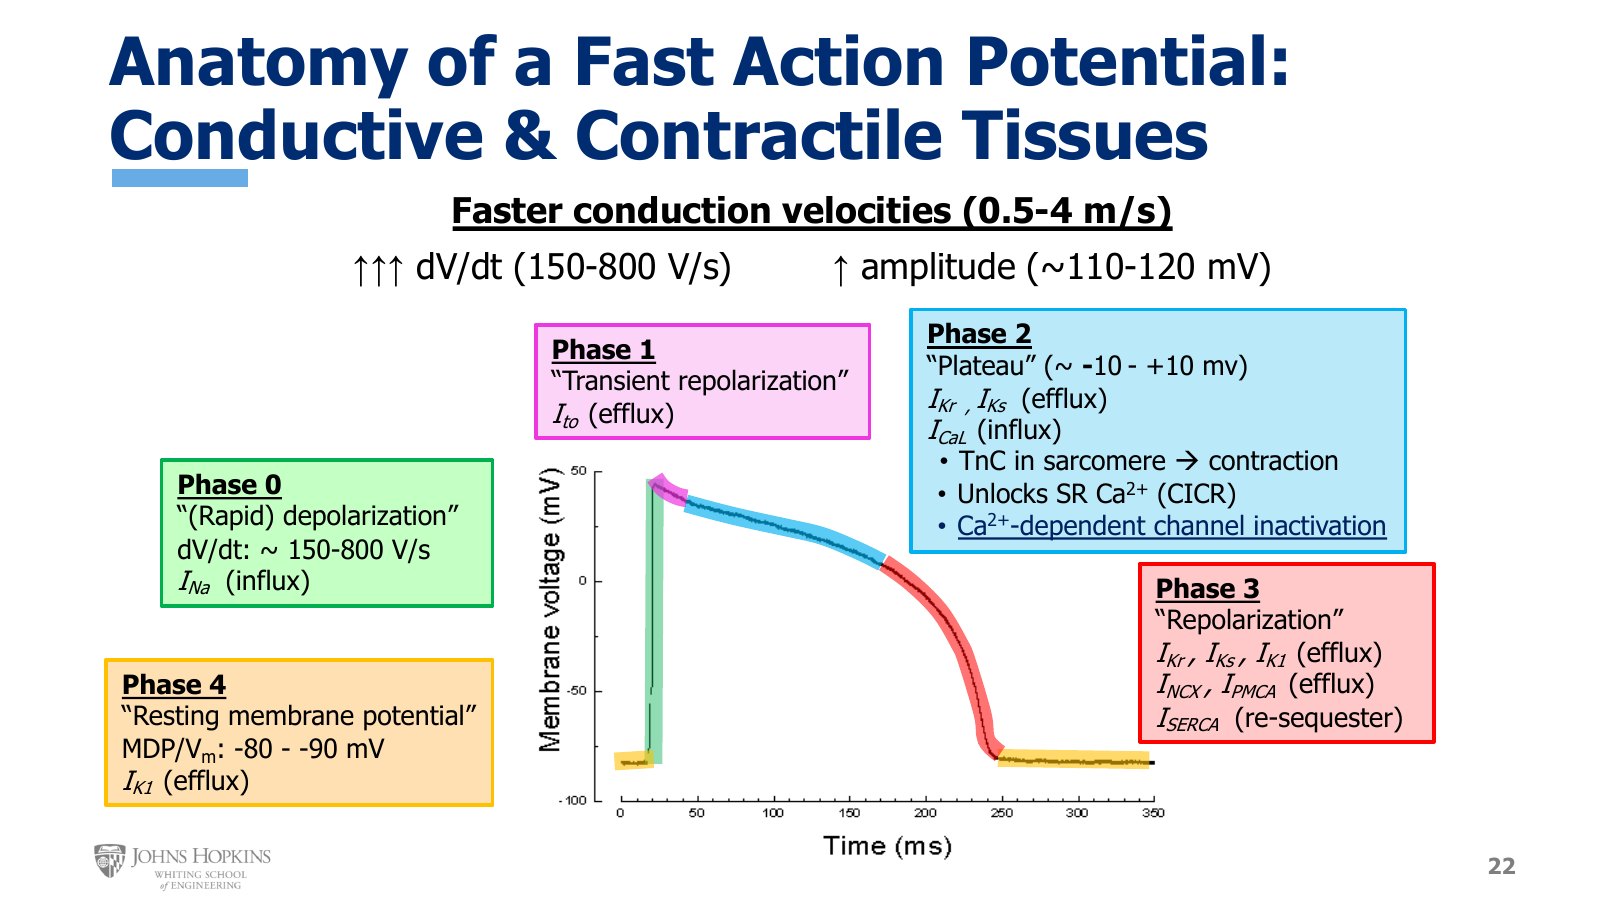
Slide 22. The fast action potential, color-coded by phase, with each phase’s name and currents. Phase 4 yellow, phase 0 green, phase 1 pink, phase 2 blue, phase 3 red.
Fast action potentials occur in both conductive and contractile tissue, and key elements of the waveform produce the much faster conduction velocities in these tissues.
dV/dt of phase 0 is much higher than in slow action potentials, anywhere from 150 to 800 V/s.
Overall amplitude is much greater, in the neighborhood of 110 to 120 mV, due to a more negative resting potential and a more positive peak.
Together, the higher dV/dt and amplitude give conduction velocities from 0.5 to 4 m/s.
Phase 4: resting membrane potential
Phase 4 is completely flat, with no spontaneous pacemaker potential. Resting membrane potential varies with the specific tissue but sits between −80 and −90 mV. Really only one major current is active: IK1, the inwardly rectifying current. Most potassium currents are activated by depolarization and open sometime during the action potential itself. IK1 is different. It is quite active at very negative millivoltages, like those of phase 4, and decreases as the membrane gets more positive.
Phase 0: rapid depolarization
The dV/dt varies with the specific tissue but runs anywhere from 150 to 800 V/s. The primary current is an inward sodium current, INa, through voltage-gated sodium channels. This should feel familiar from depolarization in the excitable membranes module.
Phase 1: transient repolarization
At the peak, typically around +30 mV or so, the voltage-gated sodium channels close and a few potassium channels open briefly. This outward potassium current is the transient outward current, Ito, and it produces a brief, or transient, repolarization. That is phase 1.
Phase 2: plateau
Next comes the phase 2 plateau, right around 0 mV, plus or minus 10 mV. A couple of things happen.
First, more potassium channels open, producing much greater potassium efflux. The rapid potassium current, IKr, kicks in and is soon joined by the slow potassium current, IKs. Yet membrane potential holds more or less steady during phase 2, so this net efflux of positive potassium ions must be offset by a net influx of another positive ion, calcium. The L-type calcium current, ICaL, kicks in during phase 2.
This inward calcium current matters beyond its part in the action potential.
Contraction. Calcium ions entering the cell either head to the sarcomeres to bind troponin C, or bind the ryanodine receptor calcium channel on the sarcoplasmic reticulum and stimulate calcium-induced calcium release.
Closing the calcium channels. A job not covered before. L-type calcium channels are sensitive to intracellular calcium concentration. When the intracellular pool of free calcium gets big enough, it stimulates closure of the calcium channels. This is calcium-dependent channel inactivation.
Phase 3: repolarization
When the calcium channels close, potassium efflux is completely unopposed, and the membrane repolarizes very quickly. That is phase 3. IKr and IKs carry the first part of phase 3. As membrane potential becomes more and more negative they fade out, and IK1 takes over the rest of repolarization.
Intracellular calcium also needs to decrease during phase 3. The sodium-calcium exchanger, the plasma membrane calcium ATPase, and the SERCA pump all kick into gear. Because those transporters move ions across membranes, they are all considered currents: INCX and IPMCA as efflux, ISERCA as re-sequestration.
Fast action potential at a glance
Phase | Name | Voltage | Currents |
|---|---|---|---|
4 | Resting membrane potential | −80 to −90 mV | IK1 efflux |
0 | Rapid depolarization | 150–800 V/s | INa influx |
1 | Transient repolarization | from ~+30 mV | Ito efflux |
2 | Plateau | ~0 ± 10 mV | IKr, IKs efflux; ICaL influx |
3 | Repolarization | back to rest | IKr, IKs, IK1 efflux; INCX, IPMCA efflux; ISERCA re-sequester |
Refractory periods
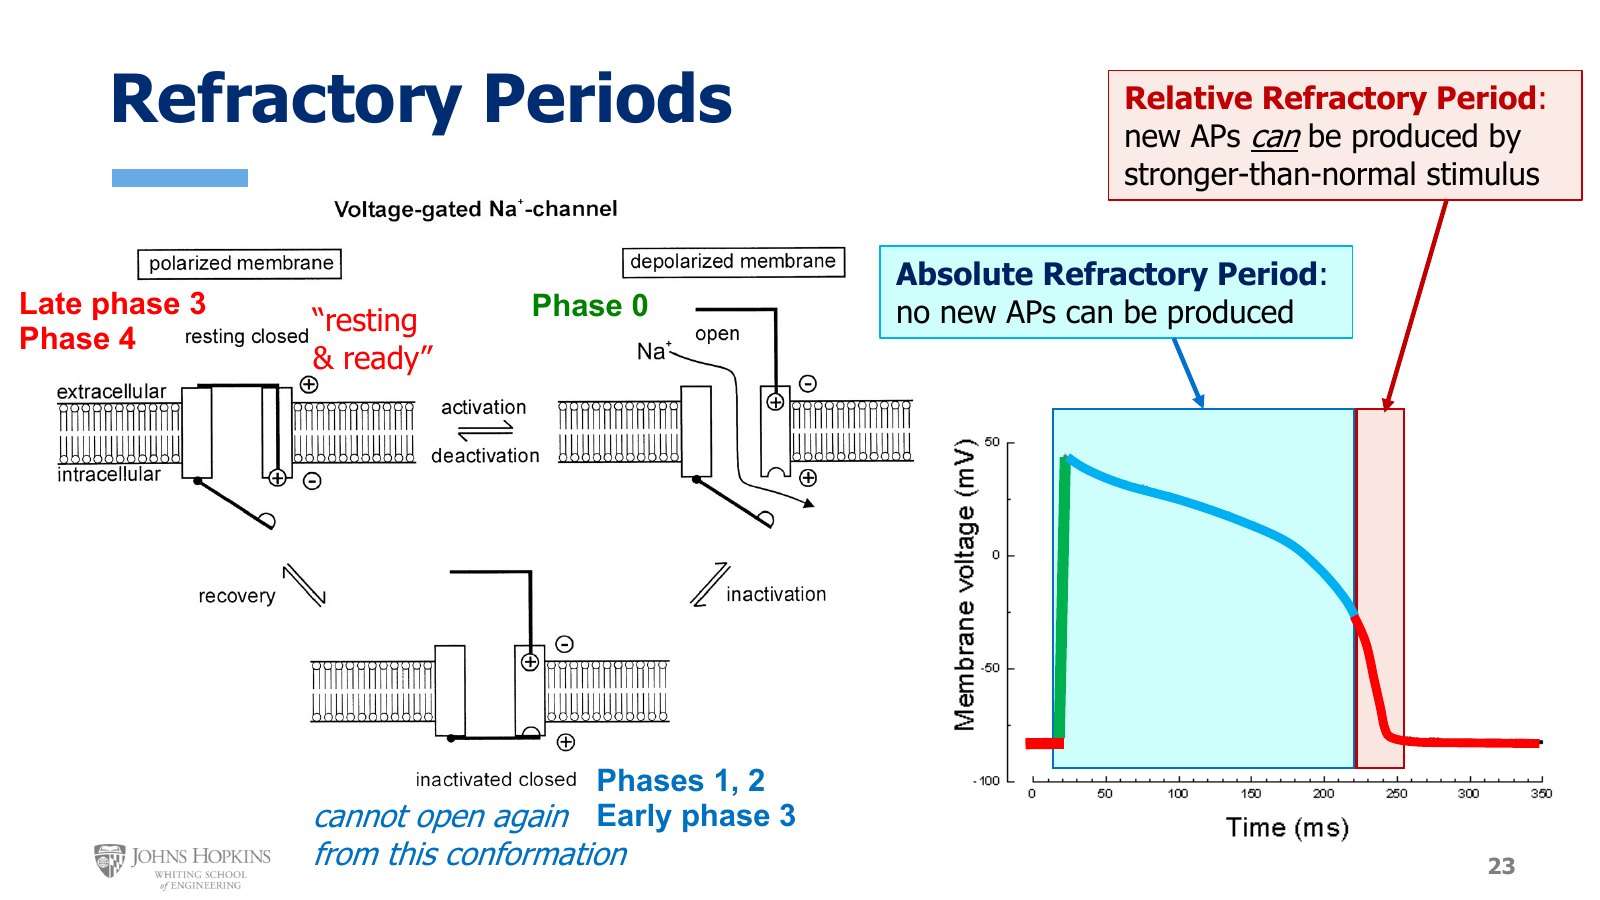
Slide 23. The voltage-gated Na+ channel’s three conformations matched to the phases of the fast action potential, with the absolute refractory period shaded blue and the relative refractory period shaded red.
Refractory periods came up with excitable membranes in general. The conformation of the voltage-gated sodium channel determines the refractory period.
Resting and ready (closed). Extracellular activation gate closed, intracellular inactivation gate open. The channel is ready and waiting to respond to a stimulus.
Open. The channel is open and conducting sodium current across the membrane.
Inactivated (closed). How the channel closes after being open: activation gate open, inactivation gate closed. While in this position it cannot open again in response to another stimulus. It must reset to resting and ready first.
Applied to the fast action potential:
During the second half of phase 3 and all of phase 4, the channel is resting and ready.
During phase 0, it is open and conducting sodium current.
During phases 1 and 2 and the first half of phase 3, it is closed but cannot open again.
The sodium channels are voltage-sensitive and do not begin to reset until about halfway through repolarization, around −50 mV or thereabouts.
As long as the channel is open, or closed in a way that it cannot open again, the cell is in its absolute refractory period. Absolutely no new action potentials can be conducted through the tissue, because no more sodium channels can open. Once the sodium channels start resetting in the middle of phase 3, the cell enters the relative refractory period. Not all sodium channels have reset yet, but enough have that a very strong, stronger-than-normal stimulus could produce a response. By the time the membrane has repolarized all the way back to resting potential, the sodium channels have finished resetting, the cell is no longer refractory, and it is ready for the next stimulus.
Conductive tissue
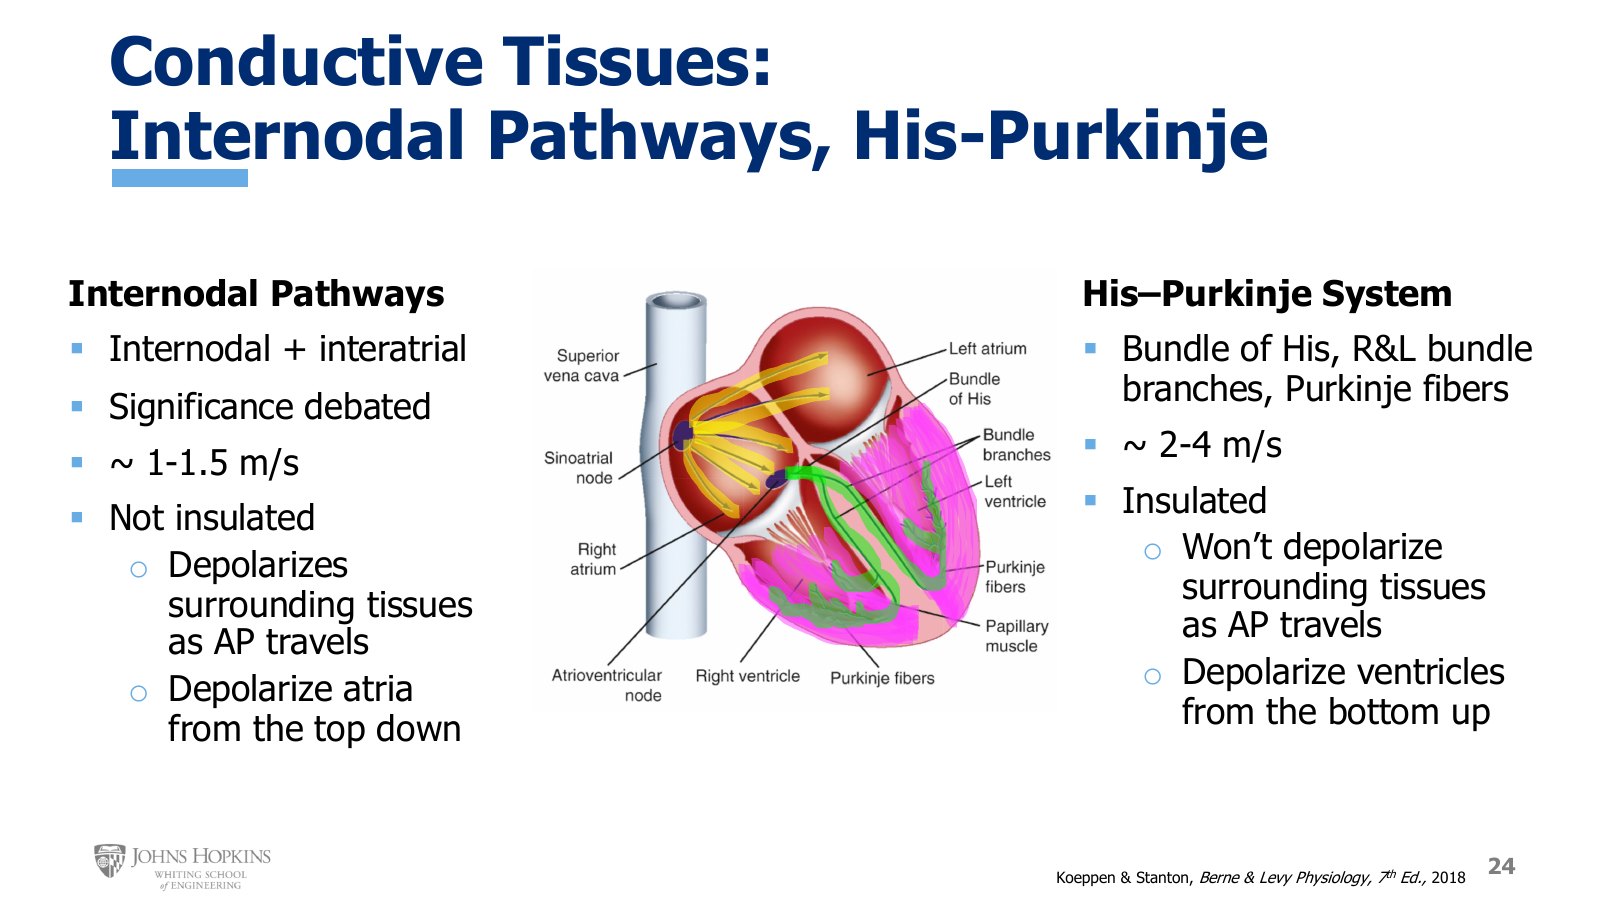
Slide 24. Internodal pathways (yellow) fanning through the atria from the SA node, and the His-Purkinje system (green) running down the septum and up the ventricular walls.
Internodal pathways. These carry the signal to the atrial muscle cells. They are both internodal and interatrial: the action potential spreads through the right atrium from the SA node to the AV node (the true internodal pathways) and also from the right atrium to the left atrium (the interatrial pathways).
Their significance is still debated. Some say the atria do not really need them; others suggest they are instrumental in spreading the action potential.
Conduction speed is 1 to 1.5 m/s.
They are not insulated. As the signal travels down from the SA node, they depolarize the surrounding atrial cells along the way, ensuring atrial depolarization from the top down.
His-Purkinje system. The counterpart in the bottom half of the heart: the bundle of His, then the right and left bundle branches going down the septum in the middle, and finally the Purkinje fibers projecting upward into the ventricular muscle.
Conduction speed varies from 2 m/s in the bundle branches up to 4 m/s in the Purkinje fibers.
It is insulated, so it does not accidentally depolarize nearby ventricular tissue as signals travel. Signals travel from the bundle down the bundle branches to the apex, then up through the Purkinje fibers, before the insulation disappears and the fibers interface with ventricular muscle cells. This ensures ventricular depolarization occurs in a deliberate, orchestrated manner from the bottom of the heart up.
Contractile tissue: atria and ventricles
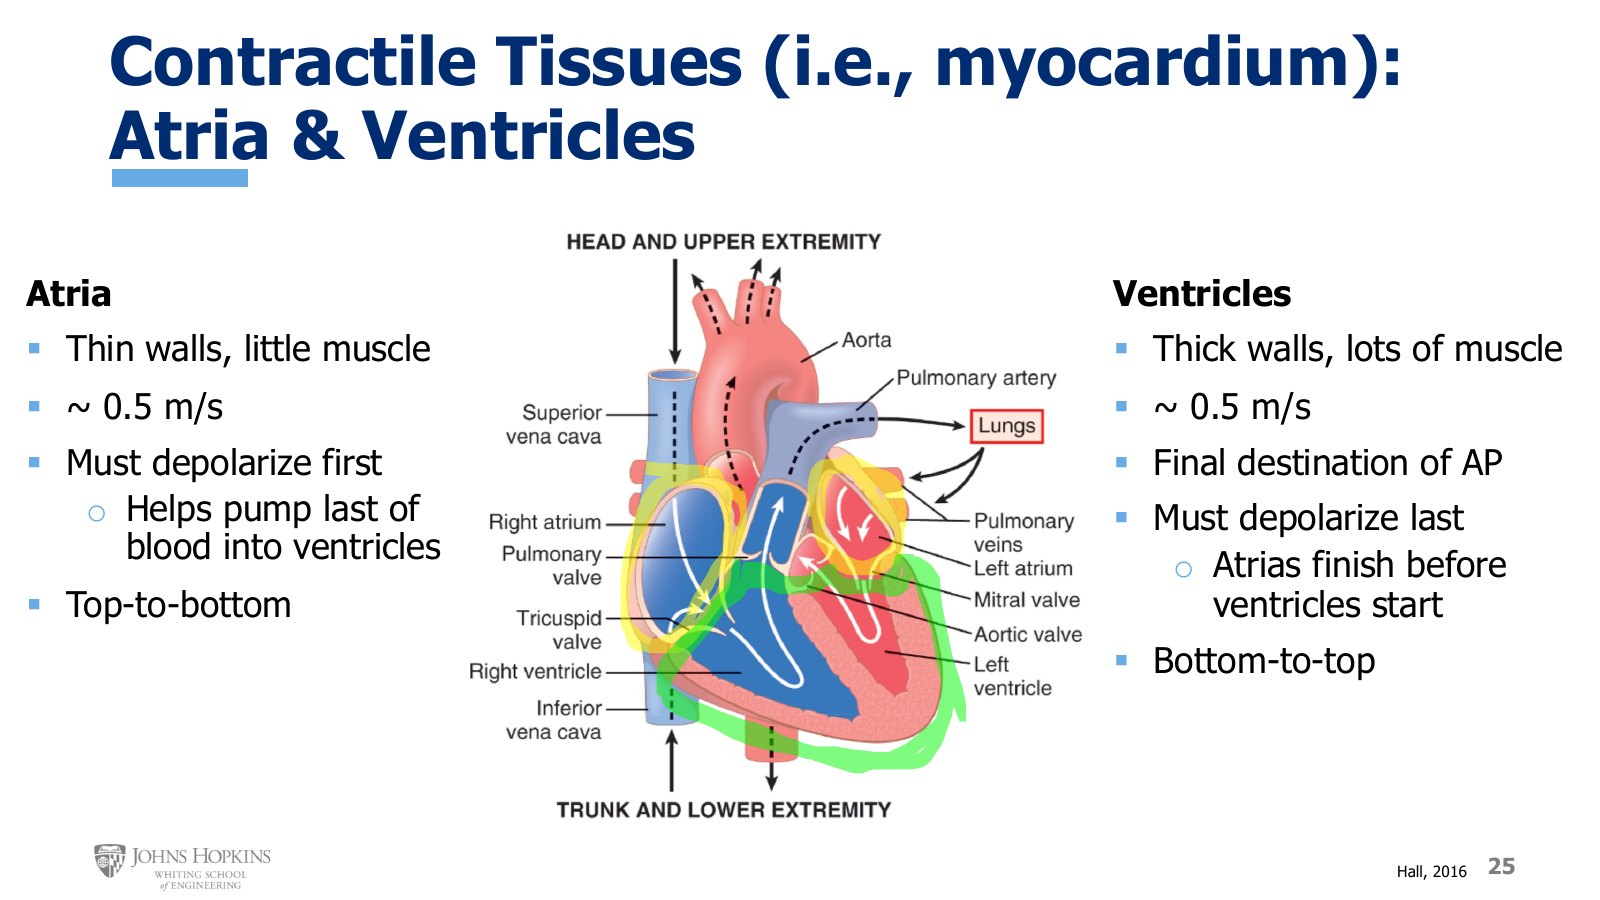
Slide 25. The atria (yellow) and ventricles (green) highlighted on the heart diagram, with wall thickness, conduction speed, and timing for each.
This is mostly review, gathered together and presented in a unified manner.
Atria. Very thin-walled, because they do not need much muscle: they only pump blood about three inches down into the ventricles. Conduction is around 0.5 m/s. Their job when they contract is to fill the relaxed ventricles before the ventricles contract. If the atria contract before the ventricles, they must also depolarize before the ventricles. Because they pump blood down toward the valve at the bottom, they contract, and so depolarize, from the top down.
Ventricles. Thick walls, lots of muscle. Conduction is about the same as the atria, around 0.5 m/s. Ventricular muscle is the final destination of the action potential, the end of the line. It must be the tissue excited last, to give the atria a chance to fully depolarize before the ventricles follow a split second later. Because the ventricles pump blood up toward the valve openings at the top of their chambers into the adjoining vessels, they contract, and so depolarize, from the bottom up.