7E · The Wiggers Diagram
The Wiggers diagram is a classic cardiovascular physiology figure that lets us graphically envision the events of the cardiac cycle as predictable patterns of pressure and volume change.
What the diagram tracks
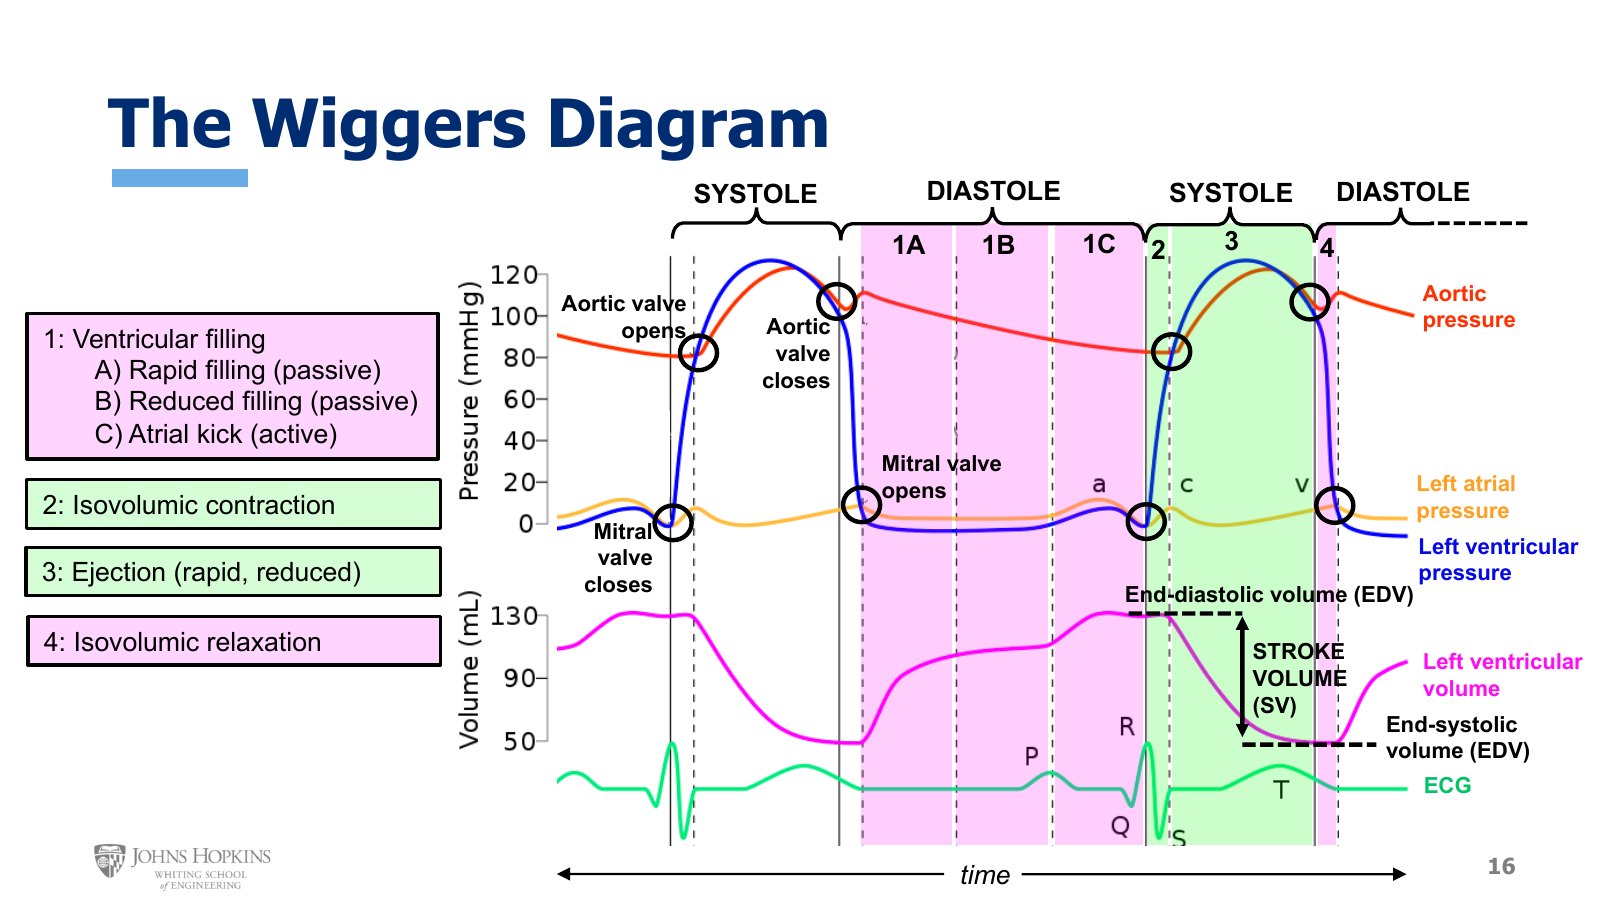
Slide 16. The fully annotated Wiggers diagram for the left heart. Pressure crossings are circled as valve events, and the phases are numbered 1A through 4 across the top.
The lecture starts from a bare-bones, unlabeled, unannotated classic Wiggers diagram and builds up the labels shown here. Its purpose is to show the simultaneous changes in atrial, ventricular, and arterial pressure along with the corresponding changes in ventricular volume, all tracked over the time of one cardiac cycle.
You can find Wiggers diagrams for the right side of the heart, with right atrium, right ventricle, and pulmonary trunk. Most show the left heart, because it is more closely studied and also tends to become dysfunctional a bit more often.
Orange: left atrial pressure.
Blue: left ventricular pressure.
Red: aortic pressure.
Pink: left ventricular volume.
All are tracked over time, unfolding from left to right. The ECG waveform sits at the bottom, with the electrical events occurring just before the physical events show up in the pressure waveforms. It is there for enrichment, so you can compare timing, for instance the P wave of atrial depolarization against the slight bump in atrial pressure that indicates atrial contraction. The ECG is not part of the formal analysis here.
Labeling the valve events
Valves change position whenever the prevailing pressure gradient reverses, so look for the places where the pressure tracings cross, where a pressure that used to be lower is now higher or vice versa.
Mitral valve closes: left ventricular pressure rises above left atrial pressure. The mitral valve is the AV valve of the left heart.
Aortic valve opens: left ventricular pressure keeps rising until it is higher than aortic pressure.
Aortic valve closes: left ventricular pressure falls below aortic pressure.
Mitral valve opens: left ventricular pressure falls below atrial pressure again.
Contraction raises pressure and relaxation lowers it, so systole and diastole can be broadly labeled from the pressure tracing. Both systole and diastole have isovolumic stages and kinetic stages where blood volume changes, so those get labeled next.
Step 1: ventricular filling
It is conventional to start the cardiac cycle with ventricular filling, the kinetic phase of diastole. The previous lecture gave filling two parts, passive and active. Here it gets more nuanced, with three sub-stages:
1A, rapid filling, passive.
1B, reduced filling, also passive.
1C, atrial kick, active.
These three sit in the middle of the diagram, where left ventricular pressure is quite low, confirming a diastolic, relaxed phase, and ventricular volume is increasing, confirming a filling phase.
1A, rapid filling, shows a large vertical increase in volume over a given period of time. Filling is rapid because the ventricle is not very full to begin with, so it can accommodate lots of volume as quickly as it can flow in.
1B, reduced filling, shows a much smaller increase in volume over a given period of time. Filling slows because the ventricle is starting to get full and the walls are starting to fight back a little. There just is not enough pressure to force the walls out to accommodate more volume.
1C, atrial kick, is atrial contraction providing that force, the extra pressure to cram the last bit of volume into the ventricles. The rise in orange atrial pressure is the evidence of atrial contraction, and the final boost in ventricular volume is the result. At the end of diastole the filling volume is finalized as the end-diastolic volume.
Step 2: isovolumic contraction
The shift into systole starts with isovolumic contraction, the very short green phase. Several clues identify it:
The blue left ventricular pressure suddenly increases very rapidly, a sure sign that some part of systole is underway.
The pink volume tracing has not moved yet. No change in volume means isovolumic.
As a double check, all heart valves are closed during isovolumic phases. Here the mitral valve has already closed and the aortic valve is not yet open.
Step 3: ventricular ejection
Ejection, the kinetic phase of systole, is the longer green phase. It is still systole because the blue left ventricular pressure is still high; the ventricle is still generating force and contracting. It is ejection because the volume tracing is decreasing, meaning the ventricle is losing volume, ejecting blood into the aorta. The slide labels this phase rapid and reduced.
The volume left in the ventricle at the end of systolic ejection is the end-systolic volume. The vertical change between end-diastolic and end-systolic volume is the volume of blood ejected during that cardiac cycle, the stroke volume: the volume of blood ejected in a single heartbeat. It is a critical marker of cardiac function, covered more in lecture 7F.
Step 4: isovolumic relaxation
The last step is isovolumic relaxation, the brief pink phase just after systolic ejection.
It must be a diastolic, relaxation phase because the blue left ventricular tracing takes a rapid dive. A major decrease in pressure like this can only come about through relaxation.
It is isovolumic because the volume tracing has not moved. There is no change in volume during this brief phase.
As a double check, the aortic valve has already closed and the mitral valve is not yet open, so both AV and semilunar valves are closed.
That completes all steps of the cardiac cycle.
Wiggers diagrams in other sources
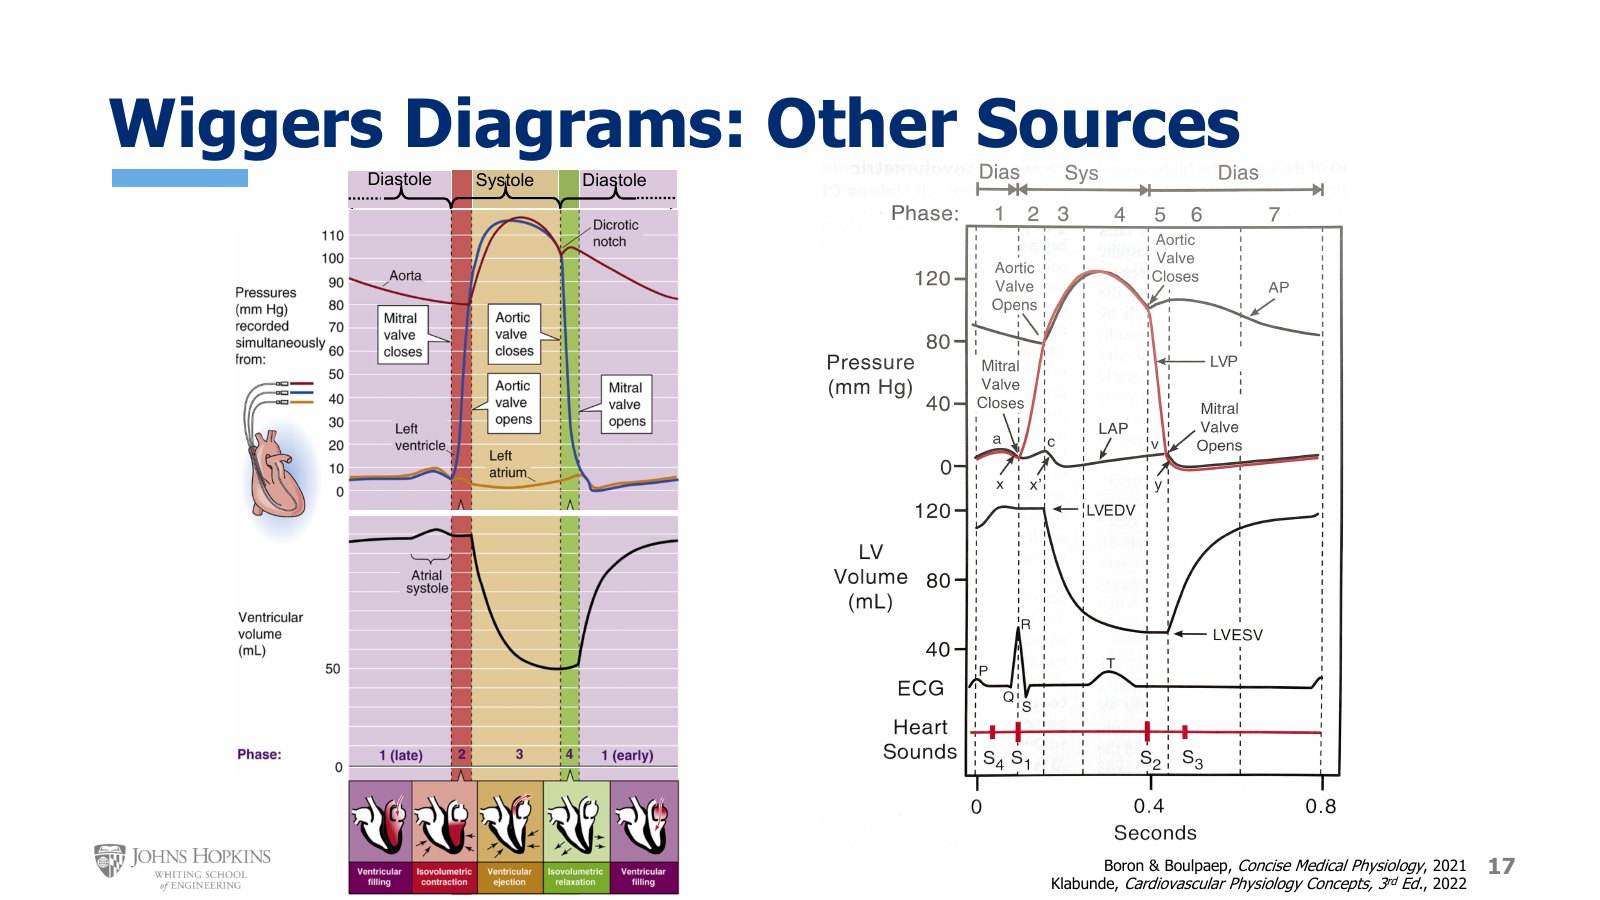
Slide 17. Two textbook Wiggers diagrams. Left, phases color-coded. Right, phases numbered, with LVEDV, LVESV, ECG, and heart sounds labeled.
Textbooks usually present the Wiggers diagram already annotated, so it helps to see a couple of versions.
On the left, the phases are color-coded: the brief isovolumic contraction phase in red, the longer ventricular ejection phase in yellow, the brief isovolumic relaxation phase in green, and the longer ventricular filling phase in purple. The tracings show left atrial pressure, left ventricular pressure, aortic pressure, and left ventricular volume, and the valve events are labeled at dotted vertical lines where the pressure tracings cross.
On the right, the diagram is not color-coded but labels the stages and sub-stages with numbers at the top. Valve events are labeled at each pressure crossing. The left atrial pressure changes are a bit more detailed than in our analysis. Left ventricular end-diastolic and end-systolic volumes are labeled, the ECG tracing is at the bottom, and below it is the timing of the four heart sounds, the phonocardiogram.