7G · Left Ventricular Pressure-Volume Loops
The Wiggers diagram is a visual representation of the events of the cardiac cycle, complete with values for pressures and volumes. A ventricular pressure-volume loop is also a visual representation of the events of the cardiac cycle with concrete pressures and volumes. So why bother with the loop? Because it removes the time element from the graph and focuses explicitly on ventricular pressure and volume, ignoring atrial and arterial pressures altogether. That collapses ventricular pressure and volume into a single tracing that is more compact, more efficient, and can tell us a bit more than the Wiggers diagram alone can.
From Wiggers diagram to loop
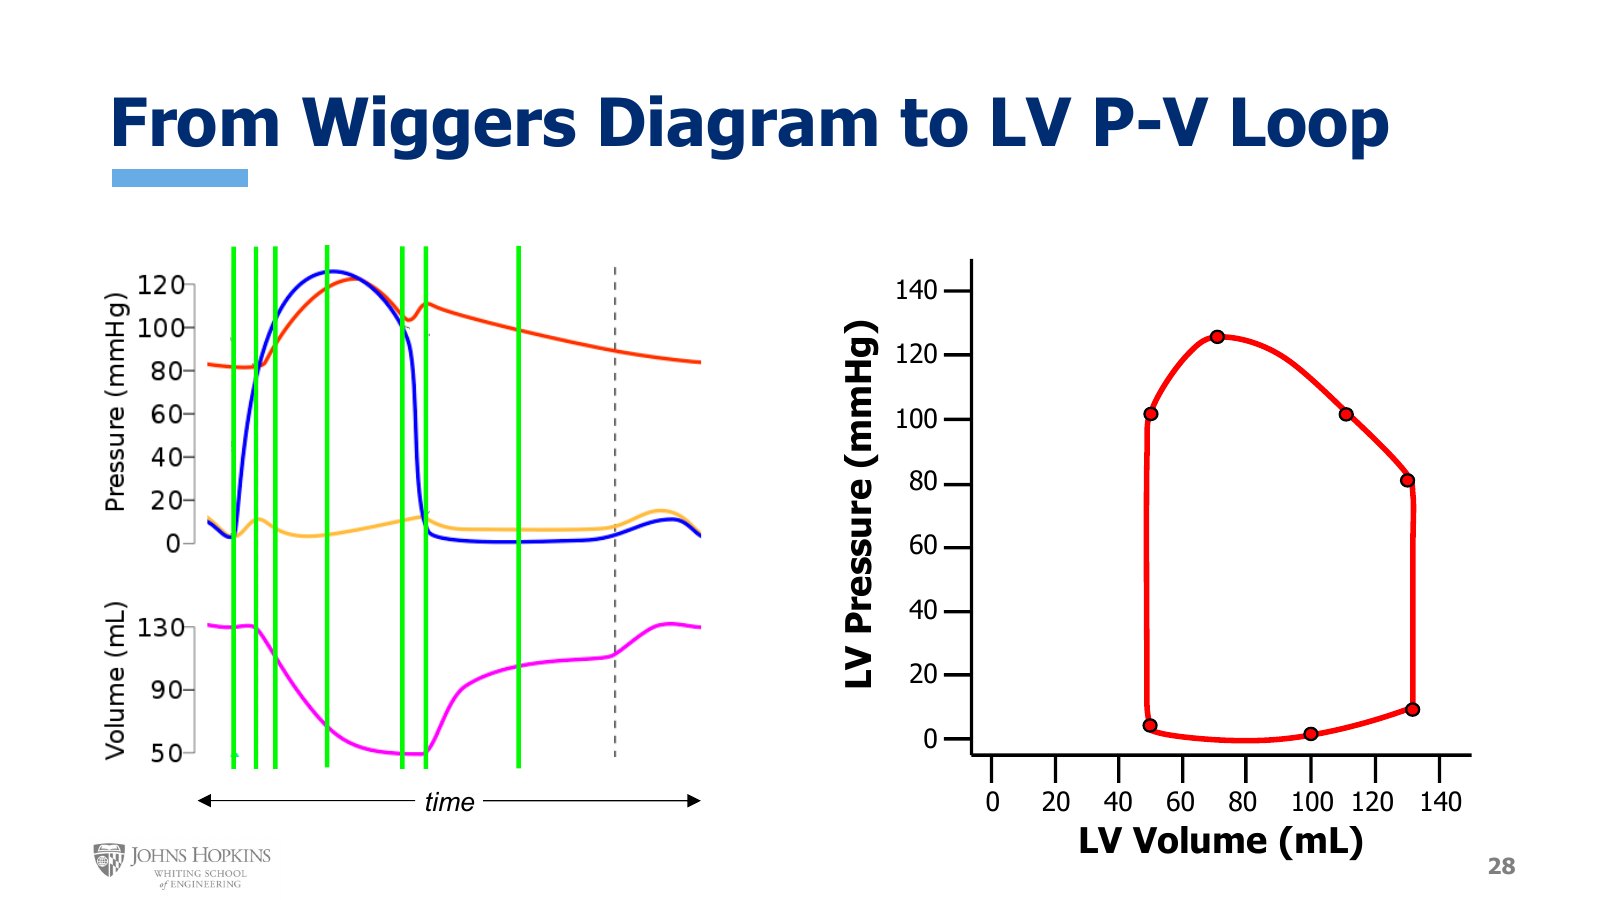
Slide 28. Green time points on the Wiggers diagram, left, transferred as dots to left ventricular pressure against volume, right.
The Wiggers diagram from lecture 7E, with aortic pressure, left ventricular pressure in blue, left atrial pressure, and left ventricular volume, is the data source. We take readings from various time points in the cycle and transfer them to a graph with left ventricular pressure on the y-axis and left ventricular volume on the x-axis.
Start with the four major valve events:
Where left ventricular and left atrial pressures cross, left ventricular pressure is very low, just above 0 mmHg, and volume is at its highest, around 130 mL.
Where left ventricular and aortic pressures cross, pressure is much higher, around 80 mmHg, while volume has stayed put at 130 mL.
Where left ventricular and aortic pressures cross again, pressure is around 100 or so, and volume has decreased to its lowest, around 50 mL.
Where left ventricular and left atrial pressures cross again, pressure is back down close to 0 mmHg, and volume has stayed low at 50 mL.
That gives a very bare-bones shape, not quite enough data for the full picture, so add a few more points:
Early in ejection: pressure around 100 mmHg, volume maybe 110 mL or so.
In the middle of ejection: pressure has peaked a smudge above 120 mmHg, volume down around 70 mL or so.
In the middle of diastolic filling: pressure quite low, close to 0 mmHg, volume maybe 100 mL or so.
Points read off the Wiggers diagram
Time point | LV pressure (mmHg) | LV volume (mL) |
|---|---|---|
Mitral valve closes | just above 0 | ~130 |
Aortic valve opens | ~80 | 130 |
Early ejection | ~100 | ~110 |
Mid ejection | a smudge above 120 | ~70 |
Aortic valve closes | ~100 | ~50 |
Mitral valve opens | close to 0 | 50 |
Mid diastolic filling | close to 0 | ~100 |
Connecting all these dots gives a fairly iconic, representative left ventricular pressure-volume loop. The rest of the lecture explores everything this simple little loop can tell us about the heart.
Reading the loop: cardiac cycle events
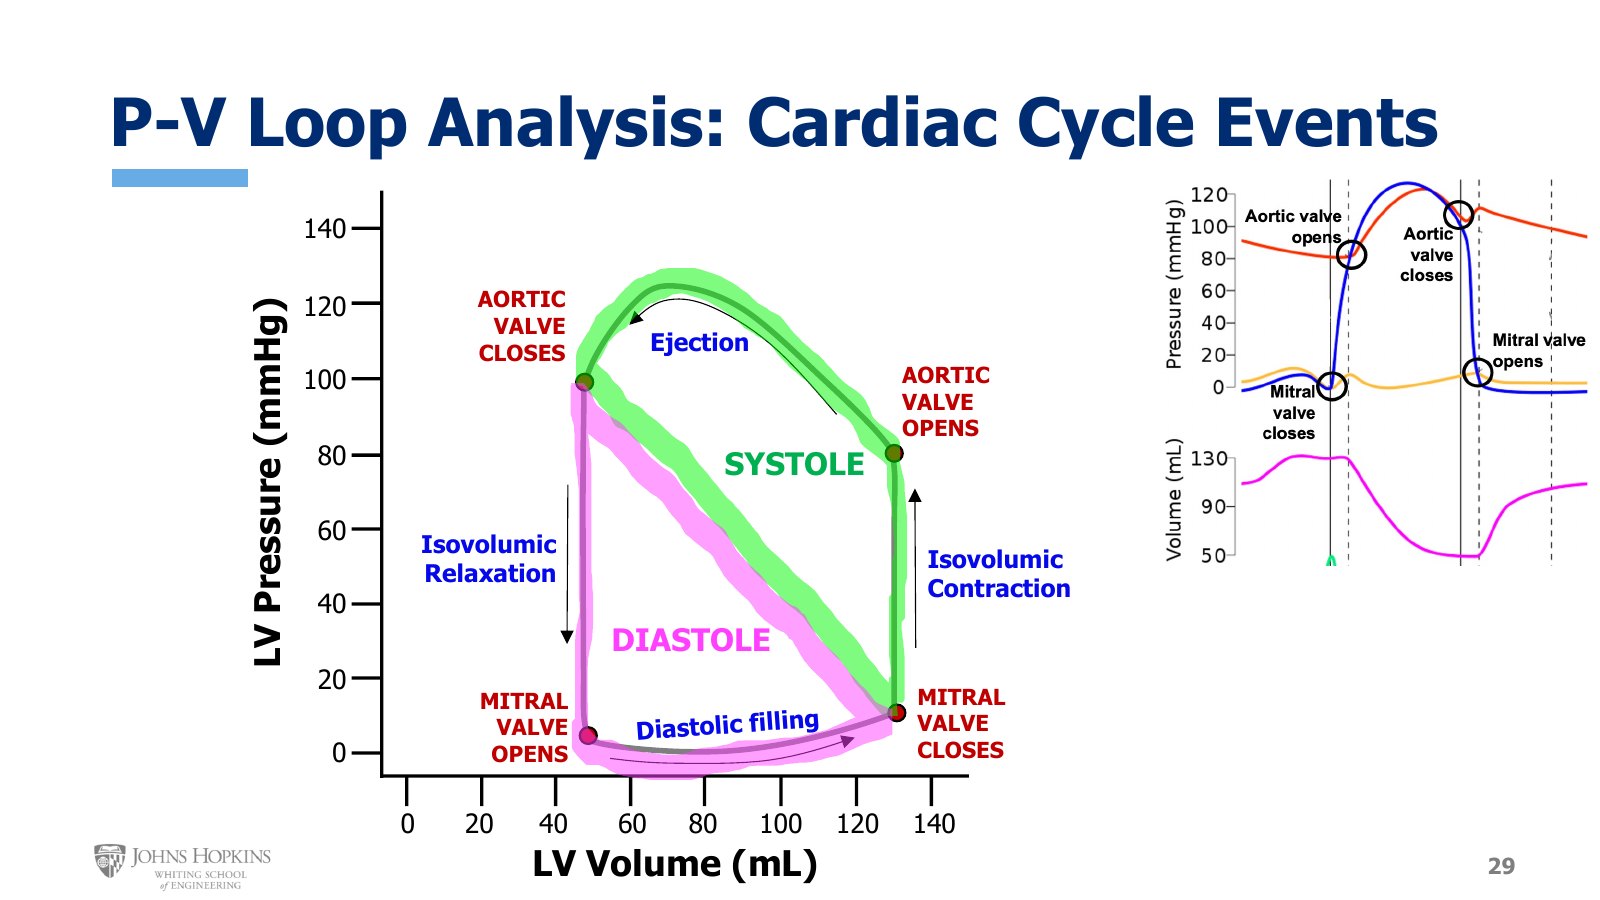
Slide 29. The loop labeled with the four valve events and four phases, systole in green and diastole in pink, beside the Wiggers diagram it came from.
Time is no longer an overt element on the graph, but it is still embedded, because the data points that produced the loop occurred in a particular sequence. The points on the loop must also occur in that sequence, and to find the order of events we read the loop counterclockwise.
The four valve events, from what pressure and volume looked like at each crossing on the Wiggers diagram:
Ventricular pressure low, volume high: the mitral valve closes. Lower right corner.
Ventricular pressure at least medium-high, volume high: the aortic valve opens. Upper right corner.
Ventricular pressure high, volume low: the aortic valve closes. Upper left corner.
Both ventricular pressure and volume low: the mitral valve opens. Lower left corner.
Isovolumic contraction falls between mitral valve closure and aortic valve opening, so on the loop it is the vertical segment on the right. To double check: isovolumic means no change in volume, and between the bottom point and the top point the change is purely vertical with no horizontal deviation at all. Volume is the horizontal x-axis variable, so no horizontal movement means no volume change. There certainly is a pressure change, though. Following the counterclockwise arrow from bottom to top, pressure rises from nearly 0 mmHg to around 80. Contraction definitely occurred, with no volume change. This really is isovolumic contraction.
Ejection runs from the aortic valve opening point to the aortic valve closing point, since ejection is the phase that occurs while the aortic valve is open. Pressure stays high, so we must still be in systole. The loop moves from right to left, starting at a high volume on the x-axis and moving to a low volume, a decrease in volume over the phase. It really is ventricular ejection.
Isovolumic relaxation falls between aortic valve closure and mitral valve opening, so it is the vertical segment on the left. Pressure drops vertically through this segment with no volume-related horizontal movement. A pressure drop with no change in volume is isovolumic relaxation.
Diastolic filling runs from mitral valve opening to mitral valve closing. Pressure stays low throughout, while volume increases from 50 to 130 mL moving left to right. Ventricular filling can only occur while the mitral valve is open, and it opens at the left point and stays open until the right point.
With the two major stages of systole and the two major stages of diastole labeled, the loop can be visually divided into systole and diastole.
Landmark volumes and pressures
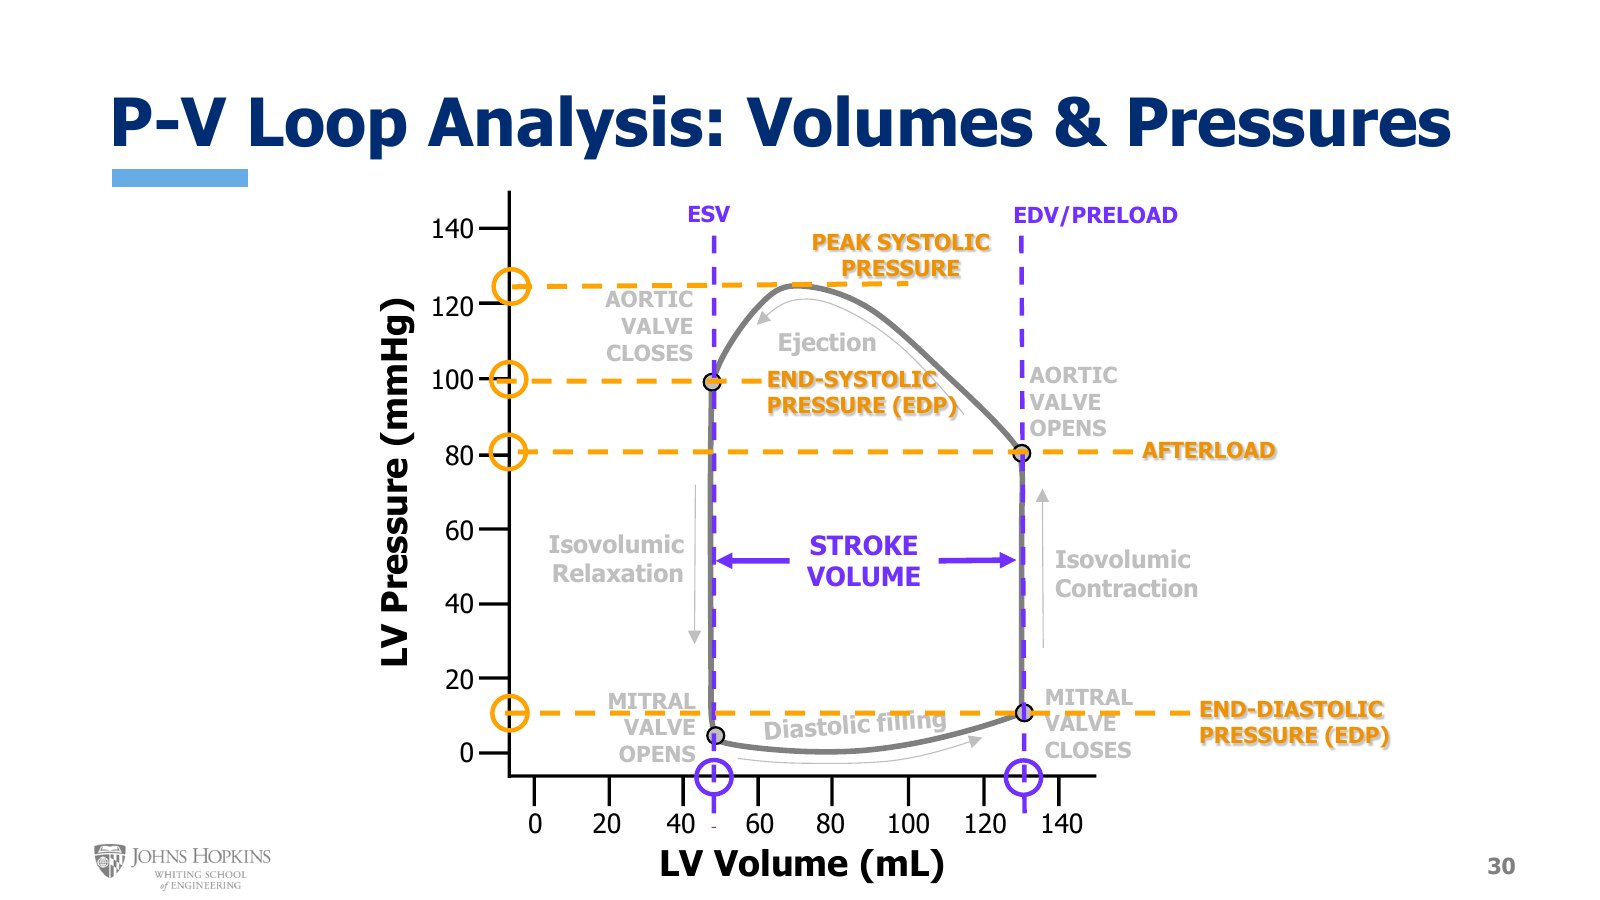
Slide 30. Landmark volumes and pressures on the loop: ESV, EDV and preload, stroke volume, peak systolic pressure, end-systolic pressure, afterload, end-diastolic pressure. The slide abbreviates end-systolic pressure as EDP.
Volumes. End-diastolic and end-systolic volumes are found from the positions of the two vertical segments.
The lower right corner is where diastole ends, so the volume there is the end-diastolic volume.
The upper left corner is where systole ends, so the volume there is the end-systolic volume.
Follow the two purple lines down to where they intersect the x-axis to read EDV and ESV.
End-diastolic volume is our major surrogate for preload, so the location of the right side of the loop tells us how much preload the heart is experiencing. Higher preload puts the right side farther to the right; lower preload puts it farther to the left.
Stroke volume is the difference between end-diastolic and end-systolic volume, so the horizontal distance between the two vertical segments is stroke volume. A wider loop has a larger stroke volume, a narrower loop a smaller one.
Pressures. Just as vertical lines through the end-diastole and end-systole points give EDV and ESV, horizontal lines through the same points pinpoint the end-diastolic and end-systolic pressures. Follow those lines left to where they intersect the y-axis.
The highest point on the entire loop, about two-thirds of the way across the ejection portion, is the peak systolic pressure: the highest pressure the left ventricle developed over this cardiac cycle.
Preload can be pinpointed as a volume-related variable on the loop, and afterload as a pressure-related one. Afterload can be thought of as the ventricular pressure it takes to open the aortic valve, and that pressure is easy to find. The vertical position of the upper right corner is a good approximation of afterload. Higher afterload moves this point up; lower afterload moves it down.
Compliance and elastance
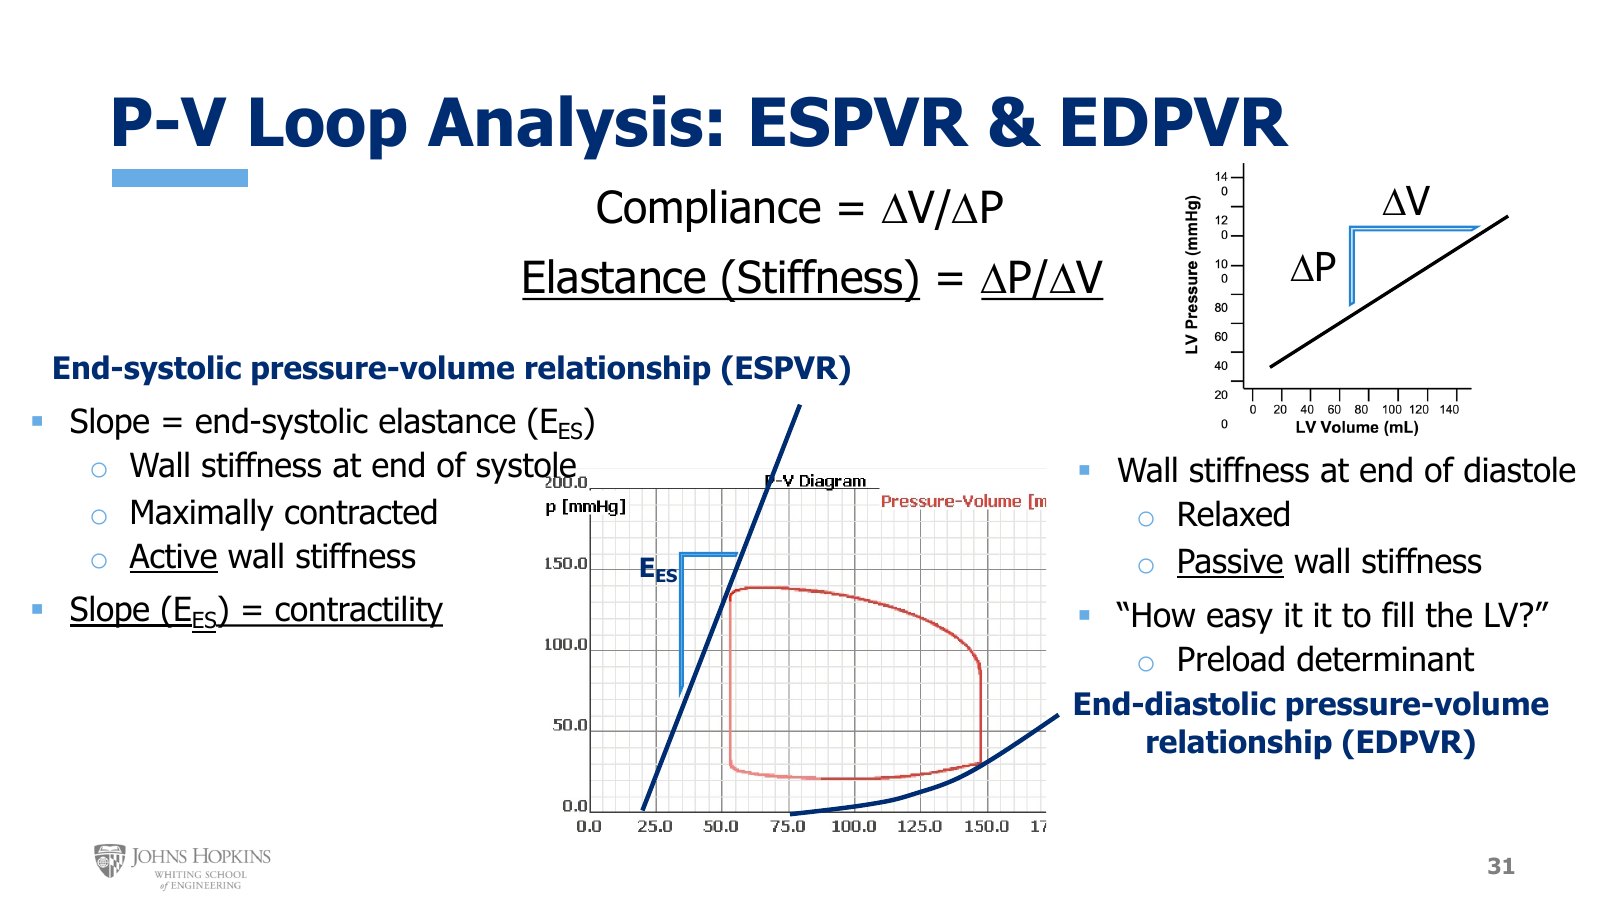
Slide 31. Compliance and elastance defined, with a family of simulated loops. ESPVR is the line through the end-systolic corners, EDPVR the curve through the end-diastolic corners.
A pressure-volume loop also tells us about the stiffness of the ventricular wall during both relaxation and contraction.
Compliance is a physical property of hollow objects that can hold a volume of liquid or gas, defined as the change in volume divided by the associated change in pressure.
An object with very compliant walls accommodates a large change in volume with only a small change in pressure. An object with walls that are not very compliant accommodates only a small change in volume, and with a fairly large change in pressure. On a graph with volume on the y-axis and pressure on the x-axis, compliance would be the slope.
On the pressure-volume graph the variables are on the opposite axes, pressure on y and volume on x. So P-V loops tell us about the reciprocal of compliance, elastance, or stiffness:
Slopes on the P-V loop graph tell us about the stiffness of the heart.
ESPVR and EDPVR
Two slope lines matter here, and both can only be drawn with several loops from the same heart produced under different filling conditions, from very high preload and end-diastolic volume to very low. The bad news is that you cannot approximate or predict that cluster of loops from just one loop like the one we have been using. The good news is that a cardiovascular physiology simulation program lets us fiddle with the filling conditions, starting with a heart that is very full and ending with one that is very empty, capturing the loop at progressively lower preloads. Then we can connect some dots and draw some slopes.
ESPVR. Connecting all the upper left points, the end of systole on each loop, gives the end-systolic pressure-volume relationship, or ESPVR. Its slope is the end-systolic elastance, EES. It tells us how stiff the ventricle is at the end of systole, when it is squeezing as hard as it can, maximally contracted. This is active wall stiffness. A stronger ventricle is stiffer at the end of systole because it is squeezing harder, while a weaker ventricle is a little squishier at the end of systole because it simply has less squeezing power. So the slope of the ESPVR is our gold standard for ventricular contractility.
EDPVR. Connecting all the lower right points, the end of diastole on each loop, gives the end-diastolic pressure-volume relationship, or EDPVR. Its curvature tells us how stiff the ventricular wall is at the end of diastole, when the heart is supposed to be relaxed and loose. It is a measure of passive wall stiffness, of how easy or difficult it is to fill the left ventricle. Ventricular compliance, or here its reciprocal, elastance, determines how much volume the ventricle can take on during filling. So the EDPVR is a preload determinant of sorts, telling us how easily the ventricle takes on extra volume.
Changes in contractility and wall stiffness
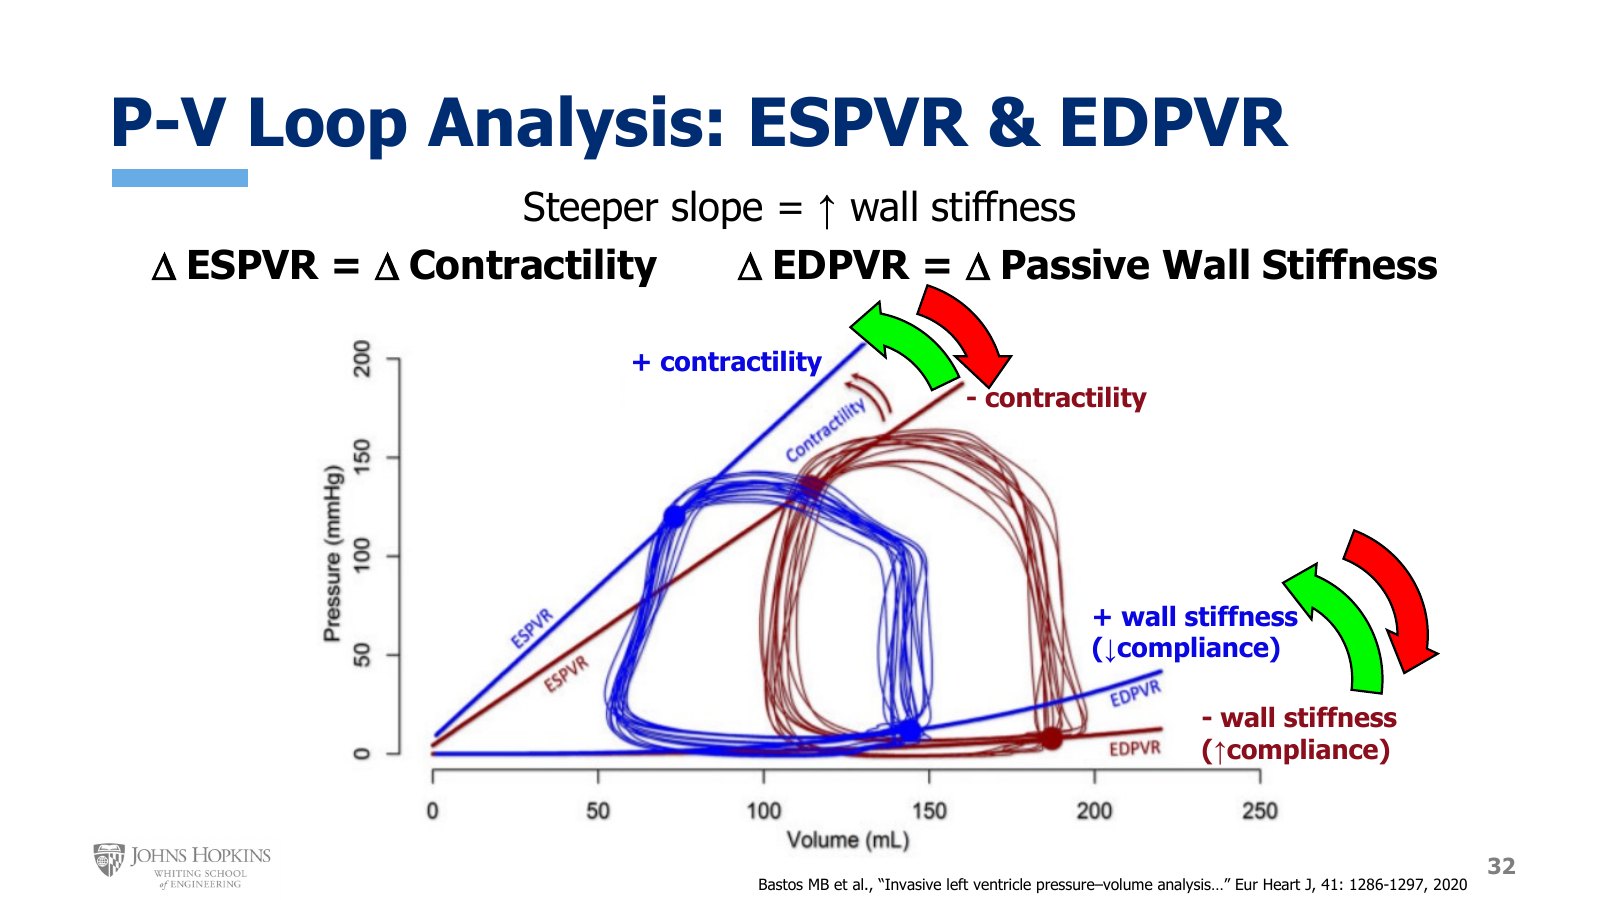
Slide 32. Two sets of loops. Blue has a steeper ESPVR and a more curved EDPVR; red-brown has a flatter ESPVR and a nearly flat EDPVR.
The figure shows two sets of pressure-volume loops.
ESPVR. The red-brown loops show depressed contractility: a flatter slope, less stiffness at the end of systolic contraction. The blue loops show enhanced contractility: a steeper slope, more stiffness at the end of systolic contraction.
EDPVR. The red loops have a very flat EDPVR, a ventricular wall that is not stiff at all and very compliant at rest at the end of diastole. The blue loops have an EDPVR with a little more upward curvature, a wall with a little more stiffness and a little less compliance at the end of diastole.
That finishes left ventricular pressure-volume loops and the module on the heart as a pump.