7F · Cardiac Output
Defining cardiac output
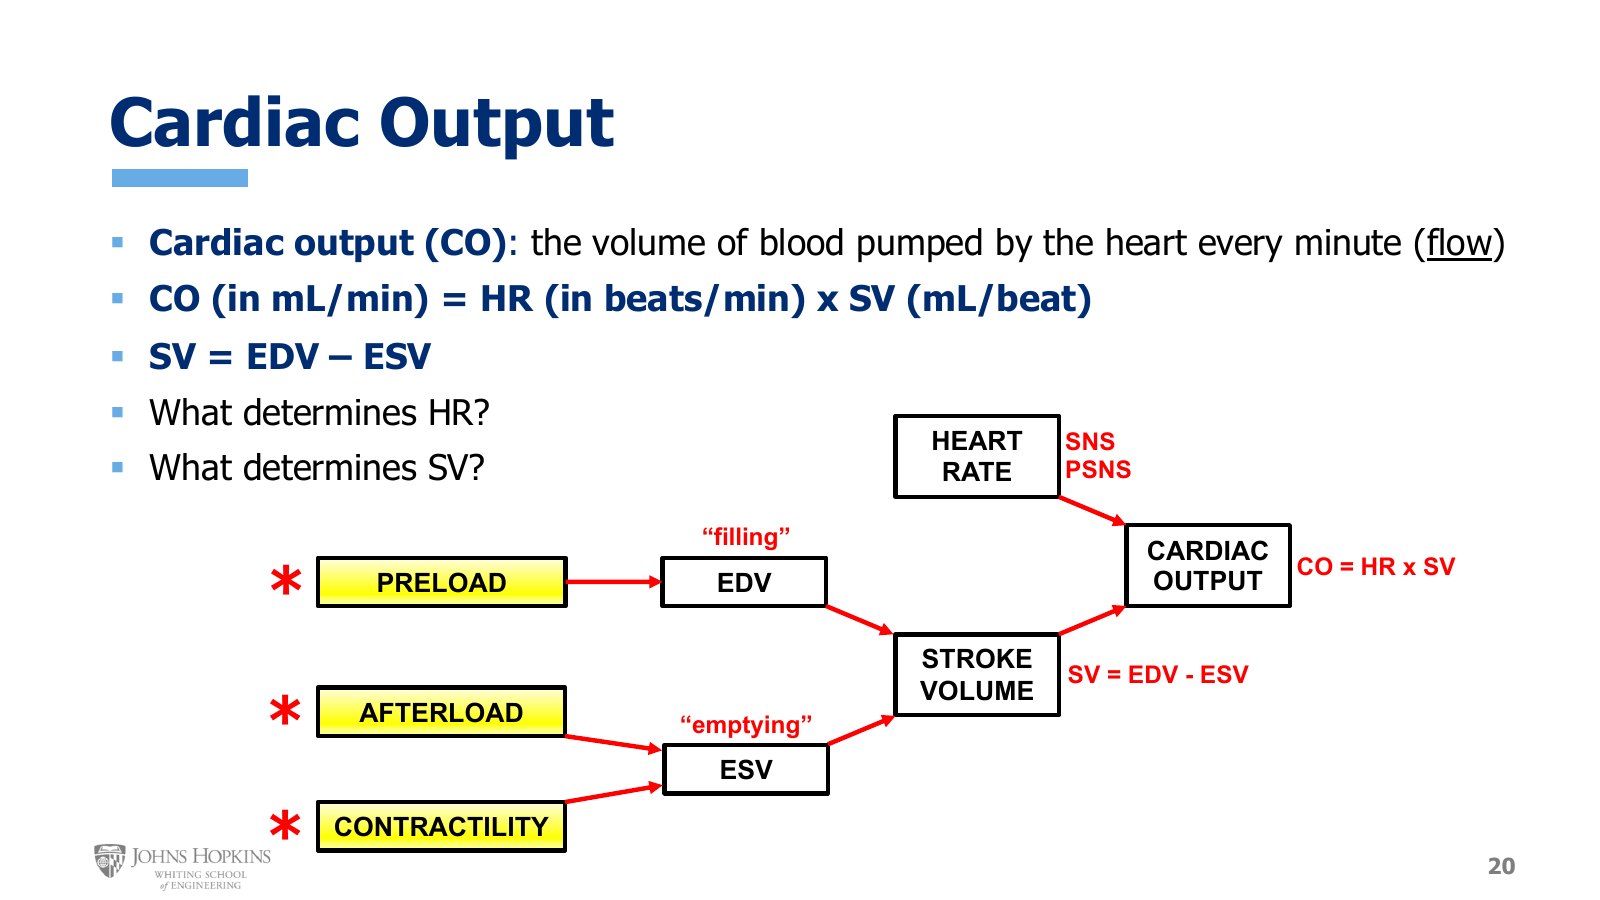
Slide 20. Flowchart converging on cardiac output. Heart rate from the SNS and PSNS. Stroke volume from EDV, set by preload, and ESV, set by afterload and contractility.
Cardiac output, or CO, is the volume of blood pumped by the heart every minute. It measures the heart’s ability to send oxygenated blood out to the tissues of the body, a measure of blood flow at the level of the whole body, so it uses units of flow, usually milliliters of blood per minute.
From the Wiggers diagram, stroke volume is the vertical distance between end-diastolic and end-systolic volume, which gives a way to quantify it:
Another way to see these relationships is as a flowchart, where all variables eventually converge on cardiac output. To find the physiological determinants of cardiac output, we have to find what determines heart rate and stroke volume.
Heart rate came earlier in the semester: the sympathetic and parasympathetic nervous systems are the major players. Stroke volume is a new concept. From the equation, anything that affects end-diastolic volume, the ability of the ventricle to fill, and anything that affects end-systolic volume, the ability of the ventricle to empty, plays a role. The rest of the lecture examines the factors that determine EDV and ESV:
Preload, related to EDV and ventricular filling.
Afterload and contractility, both related to ESV and ventricular emptying.
Preload is proportional to stroke volume
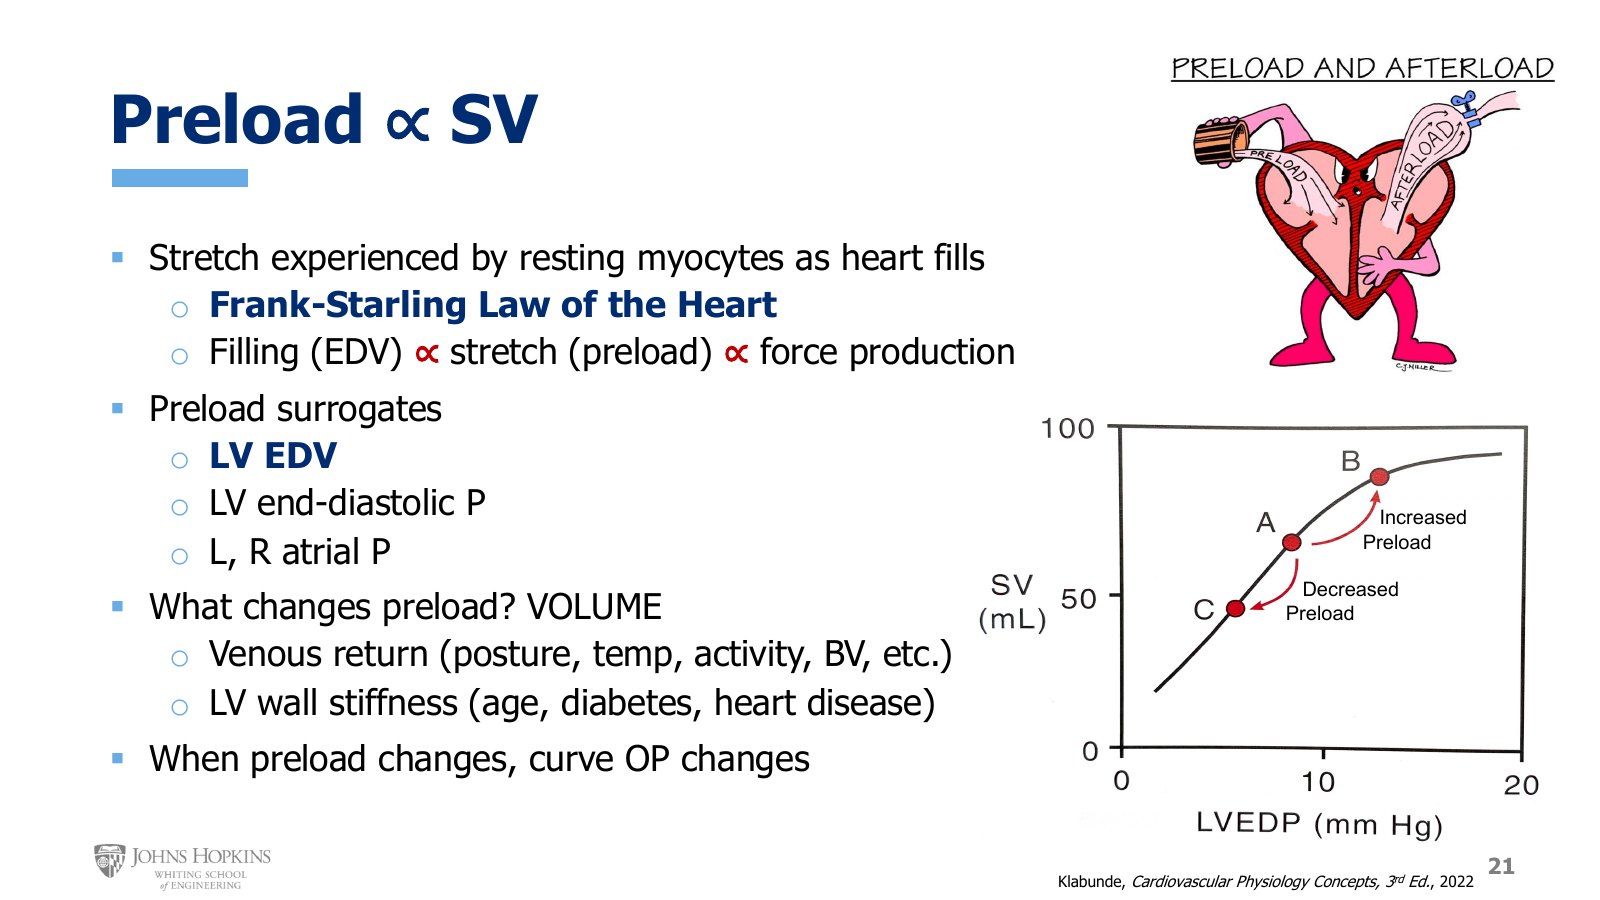
Slide 21. The Starling curve for the intact heart, stroke volume against LVEDP. Preload changes move the operating point along the curve, A to B or A to C.
Preload has a proportional relationship with stroke volume. When preload increases, stroke volume goes up; when preload decreases, stroke volume goes down.
Preload is the stretch experienced by the resting myocytes in the heart wall during filling. The idea of stretch on the resting heart should ring a bell. It is a whole-heart application of the Frank-Starling law of the heart, the length-tension relationship for cardiac muscle from lecture 4E. There, greater resting sarcomere stretch led to greater force production when the cells were stimulated to contract. In the intact heart beating inside the body, the same principle applies:
More ventricular filling and greater end-diastolic volume give greater stretch, or preload, on the muscle cells in the heart wall, which gives greater force production when the ventricle later contracts during systole. The opposite is also true: less filling, less stretch, less force.
Preload surrogates. Directly measuring the degree of stretch in the ventricular wall is difficult, so we rely on surrogate measurements that get pretty close to telling us about wall stretch.
Left ventricular end-diastolic volume is a great surrogate, because it measures filling, which contributes to and is proportional to stretch.
Left ventricular end-diastolic pressure. Pressure increases with filling and pushes outward on the heart wall, contributing to stretch.
Left and right atrial pressures. Ventricular and atrial pressures are very close to each other at the end of diastole, so atrial pressures work as more upstream surrogates of left ventricular preload.
The graph is the length-tension, or Starling curve, for the intact heart. Instead of myocardial sarcomere length on the x-axis, it uses a preload surrogate, left ventricular end-diastolic pressure. Force production increases as preload increases, and greater force gives more ejection of blood, so stroke volume is the y-axis variable.
What changes preload? Volume. Filling determines preload, which determines force. Anything that changes the blood volume in the left ventricle at the end of diastole changes preload.
Venous return, the volume of blood returning to the heart. Many factors affect it: posture, upright versus lying down; body temperature; how much your body is moving; and total blood volume, for example if you just donated blood at a blood drive.
Left ventricular wall stiffness. Under normal, young, healthy circumstances the wall has a bit of stretch to it, kind of like a balloon, so it accommodates larger filling volumes fairly easily, giving greater wall stretch and preload. As we age and experience diseases associated with aging, like advanced diabetes and heart disease, the left ventricular wall gets stiffer. It will not expand to accommodate as much volume, so the stretch it experiences decreases. Preload gets lower as we get older and sicker.
When preload changes, the Starling curve itself does not change. We simply move the operating point along the existing curve: up and to the right when preload increases, down and to the left when it decreases.
Lusitropy contributes to preload
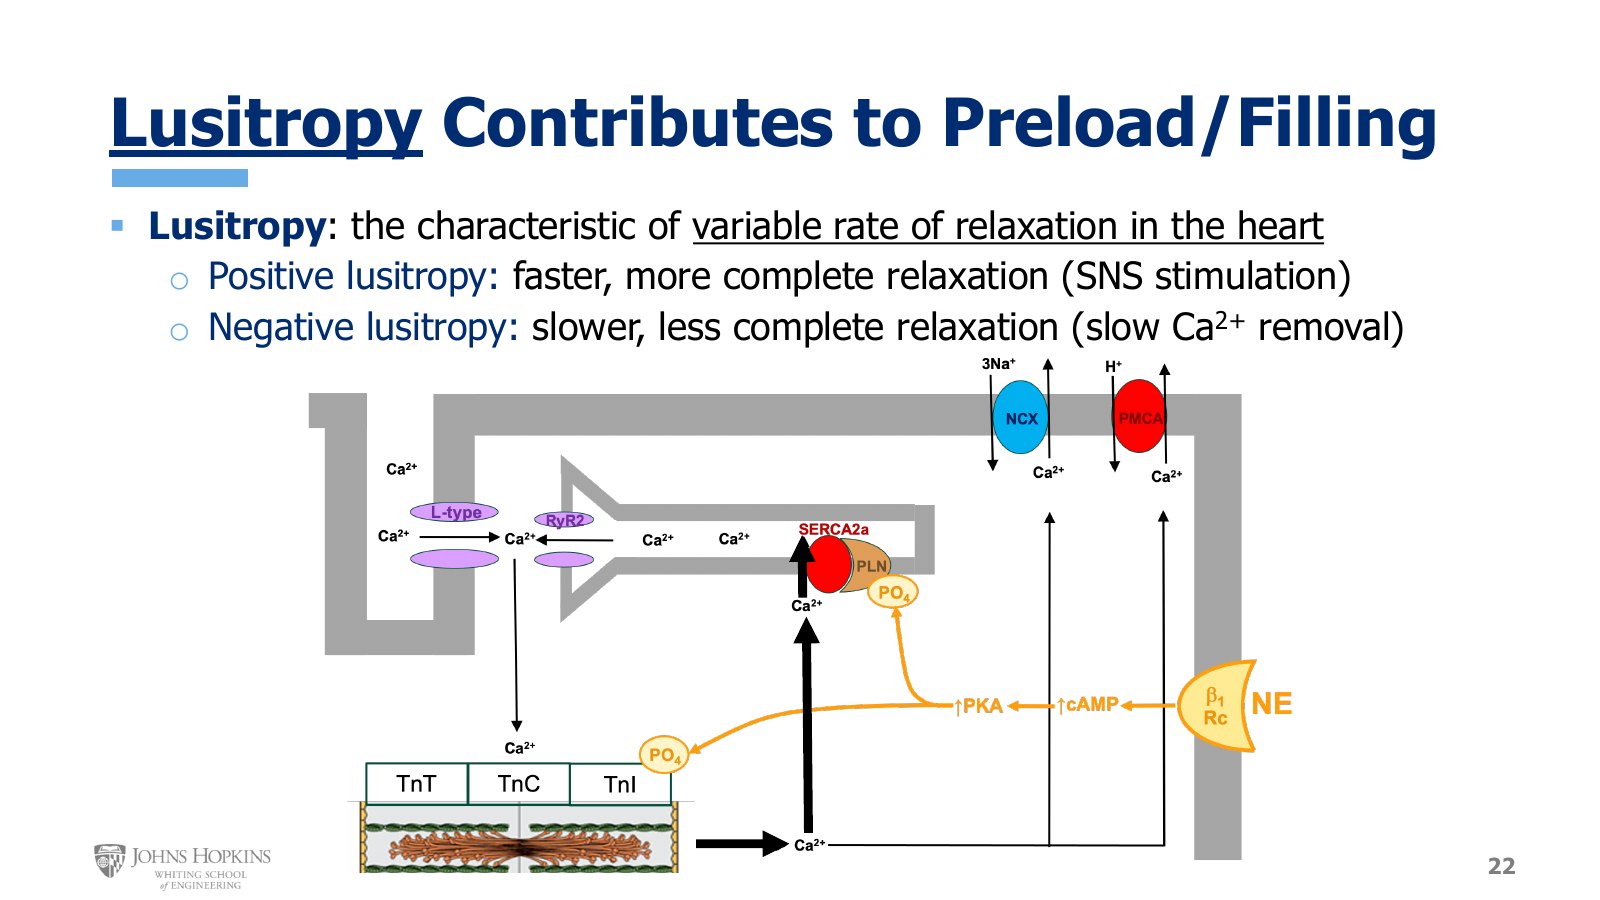
Slide 22. The cardiac myocyte from Module 4. Norepinephrine at beta-1 raises cAMP and PKA, which phosphorylates troponin I and the SERCA2a pump through its phospholamban (PLN) brake.
The cardiac electrophysiology module covered two -tropy terms, chronotropy and dromotropy, with two more associated with the heart’s mechanical, contractile function still to come. Here is one of them.
Lusitropy is the characteristic of being able to change the rate of relaxation, or loosening, in the heart. It comes up here because it contributes to preload by helping determine the stiffness of the ventricular wall during diastole.
Positive lusitropy. If the ventricular wall relaxes very quickly after contraction, there is little if any residual tension in the wall during diastole, making it very stretchy and able to accommodate lots of filling. This faster, more complete relaxation is positive lusitropy. It is associated with higher preload and is typically driven by sympathetic stimulation.
The figure, from lecture 4F on cardiac muscle function, shows the sympathetic route:
Norepinephrine stimulates beta-1 receptors on the cardiac muscle cell membrane.
Cyclic AMP increases.
Protein kinase A activity increases.
PKA phosphorylates the SERCA pump and troponin I.
Phosphorylating troponin I makes calcium dissociate from the sarcomere faster, so the sarcomere relaxes faster. Phosphorylation at the SERCA pump makes the pump work faster, removing free calcium from the cytoplasm more quickly, which also hastens relaxation. On the slide the phosphate lands on phospholamban, the brake on SERCA from lecture 4F.
Negative lusitropy. If calcium removal is slower and less effective, relaxation takes longer and is incomplete. The ventricular walls hold onto residual tension longer during diastole, making them stiffer and less able to stretch for high filling volumes. This slower, less complete relaxation is negative lusitropy, and it contributes to lower preload.
Afterload is inversely proportional to stroke volume
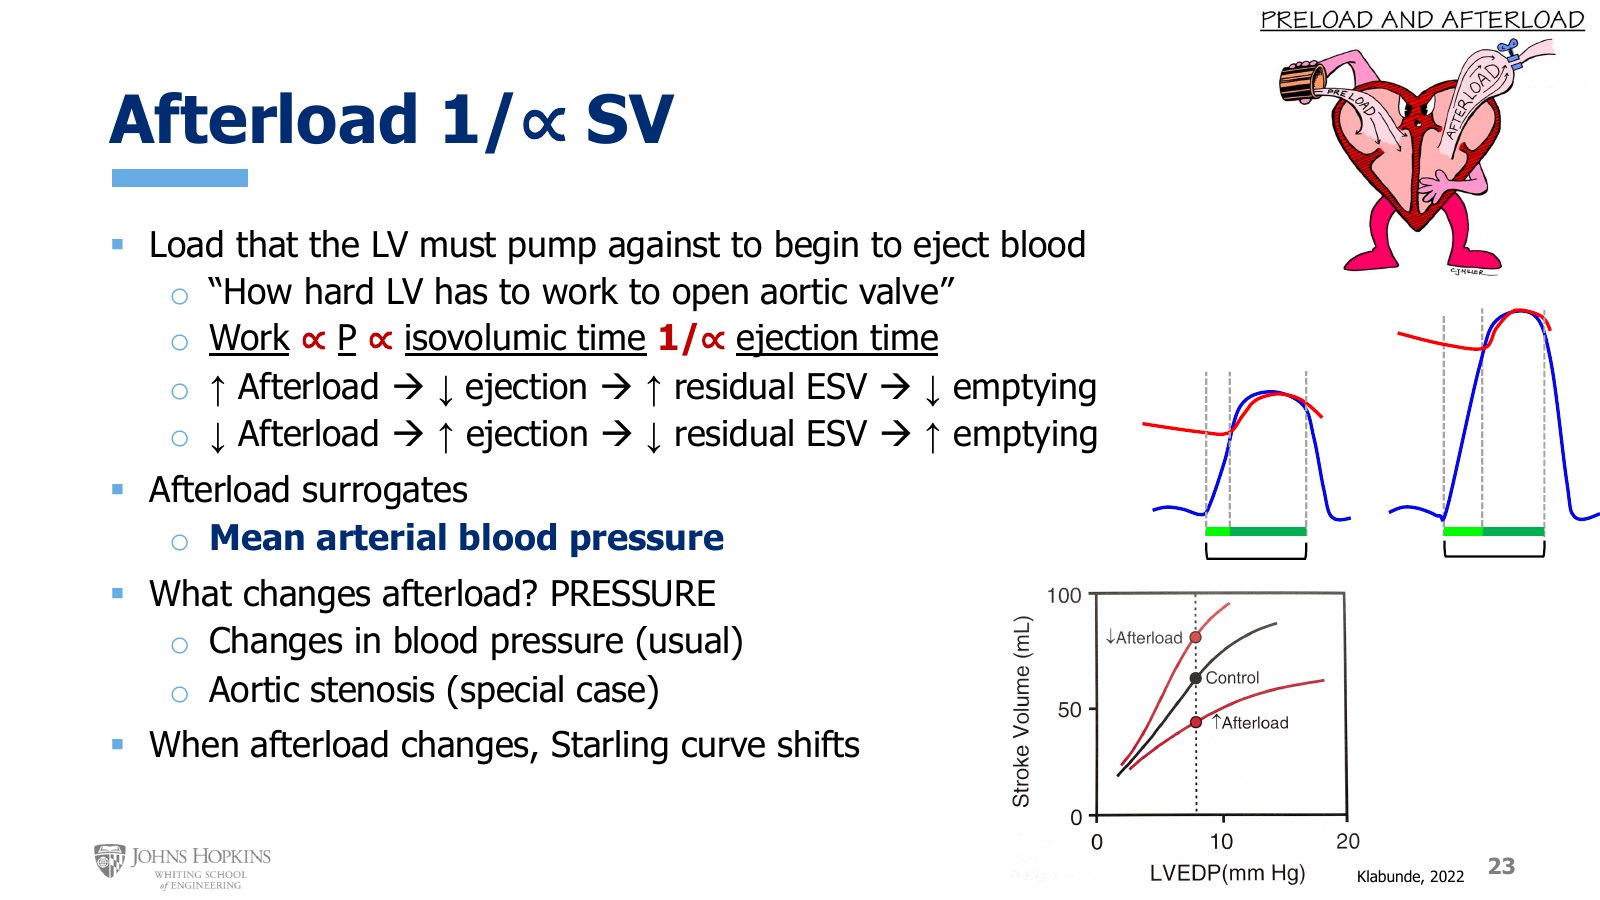
Slide 23. Two left ventricular pressure tracings with isovolumic time in light green and ejection in dark green, and the Starling curve shifting with afterload.
Now to the factors that determine end-systolic volume, and so the emptying of the ventricle. Afterload has an inverse relationship with stroke volume. When afterload is high, stroke volume is lower; when afterload is low, stroke volume is higher.
Afterload is the load the left ventricle has to pump against to open the aortic valve so it can eject blood. Essentially, it is how hard the left ventricle has to work to open the aortic valve.
The more work it takes to open the aortic valve, the more pressure the left ventricle has to generate. The more pressure it has to generate, the longer that takes: longer isovolumic contraction. And when isovolumic contraction takes more time, there is less time left for ejection.
Systole is a finite, predetermined period of time based on the timing of the action potential. We spend some of it in isovolumic contraction, generating enough pressure to open the aortic valve, and the rest ejecting blood. When the heart does not have to spend much time generating pressure, it has lots of time left to eject. When it has to generate more pressure just to open the valve, it spends more time in isovolumic contraction, with less time left to eject before systole ends.
↑ afterload → ↓ ejection time → ↑ residual ESV → poor emptying.
↓ afterload → ↑ ejection time → ↓ residual ESV → better emptying.
Afterload surrogates. The load the left ventricle pumps against is difficult to quantify and measure, so as with preload we use surrogates. The most common is mean arterial blood pressure. Pressure in the systemic arteries, particularly the aorta, is what keeps the aortic valve from opening most of the time, so it is a reasonable and very easily measured surrogate.
What changes afterload? Pressure. Anything that changes the pressure the left ventricle must generate to open the aortic valve.
Changes in blood pressure, the usual case for most people. Short-term changes come from medication or stress, and long-term changes from the gradual onset of high blood pressure as we get older.
Aortic stenosis, the special case. The scarring and calcification that keep the valve from opening fully also make it harder to open, period. The valve is rigid and thick, so opening it takes more and more pressure from the left ventricle as stenosis progresses. The diseased valve itself provides the opposition to opening.
When afterload changes, the Starling curve shifts. It shifts up, for better stroke volume at a given preload, when afterload is low, and down, for lower stroke volume at a given preload, when afterload is high.
Contractility is proportional to stroke volume
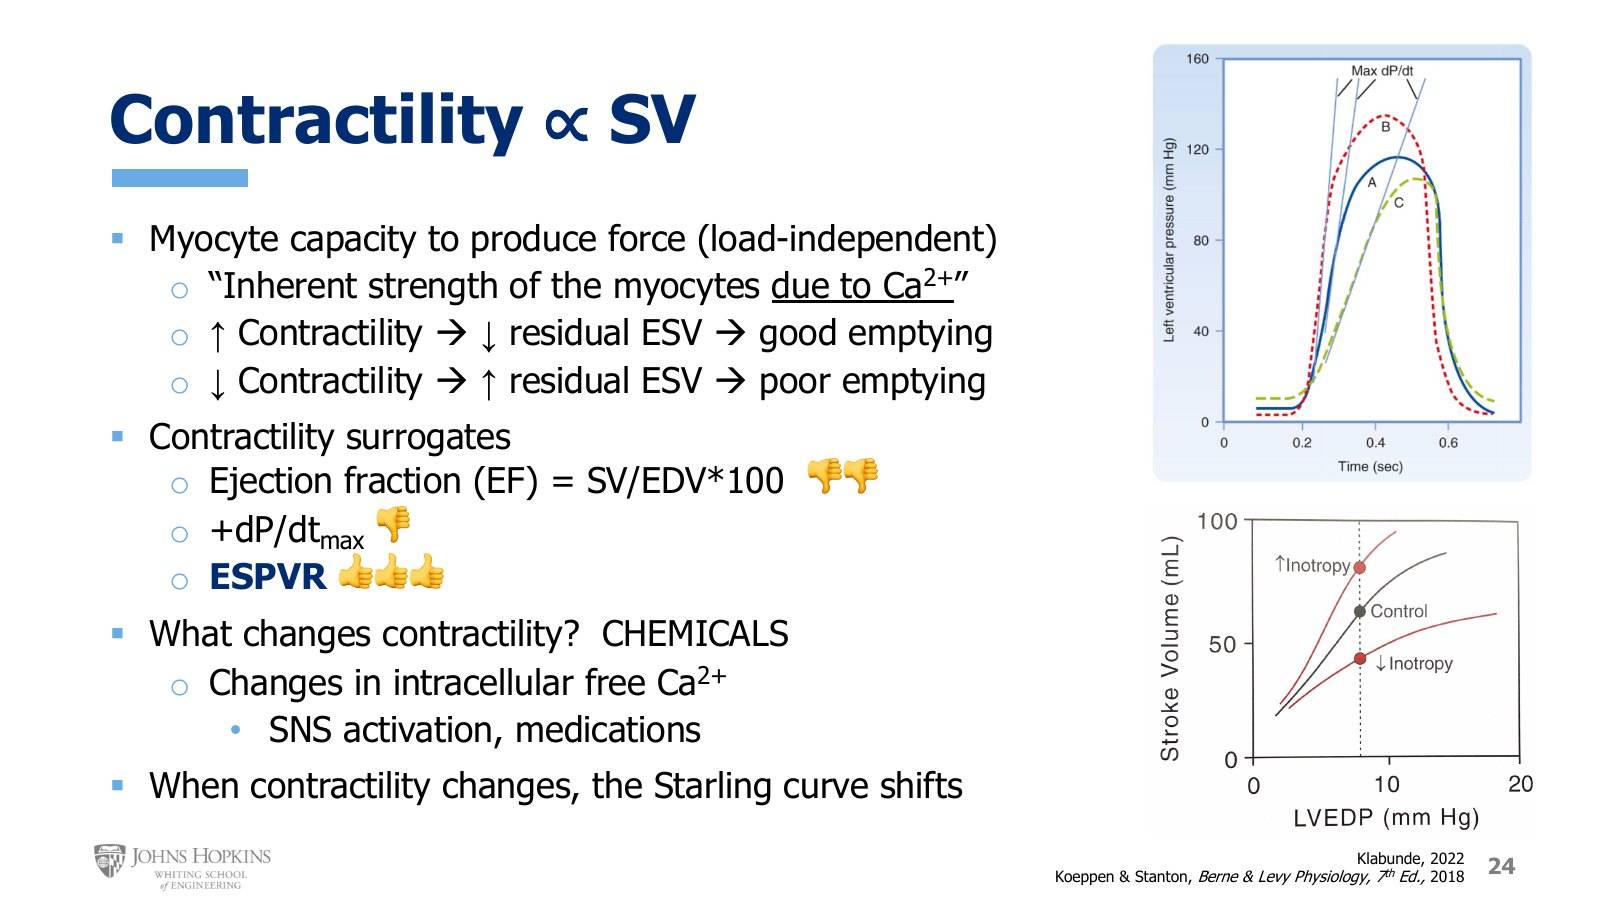
Slide 24. Contractility surrogates rated by thumbs, a dP/dt max plot for three tracings, and the Starling curve shifting with inotropy.
Contractility is directly proportional to stroke volume. When contractility is high, stroke volume is high; when contractility is low, stroke volume is low.
Contractility is the capacity of the cardiac myocytes to produce force, and it is considered a load-independent characteristic. It is simply the inherent strength of the myocytes, due to changes in intracellular calcium concentration, so it is not affected by changes in preload or afterload.
↑ contractility: high squeezing power from high intracellular calcium, powerful systolic ejection, low residual ESV, good emptying.
↓ contractility: low squeezing power from lower intracellular calcium, weaker systolic ejection, higher residual ESV, poor emptying.
Contractility surrogates. Contractility is also difficult to quantify and measure, but there is a difference here. The preload and afterload surrogates are reasonably accurate and helpful. The contractility surrogates are more problematic.
Ejection fraction, two thumbs down. The most common clinical surrogate, used mostly because it is easy. The problem: contractility is supposed to be independent of preload and afterload, yet end-diastolic volume is the denominator, and EDV is also our major surrogate for preload. Definitely not load independent, so it is not always a good measure of contractility.
Maximum systolic dP/dt, one thumb down. The steepest rate of increase in left ventricular pressure on the Wiggers diagram, as in the upper right figure. A ventricle contracting with more intensity has a steeper slope and a higher dP/dt max; one contracting with less intensity has a flatter slope and a lower dP/dt max. The problem is that changes in preload also change force production, and so dP/dt max. Preload-induced changes in force come from changes in ventricular stretch, not intracellular calcium. High preload and high contractility both generate more contractile force, but for different underlying reasons, and dP/dt max cannot distinguish between them.
ESPVR, three thumbs up. The gold standard for measuring contractility. Lecture 7G covers what it is and how it is measured. For now, know that it is the best measure of contractility in cardiovascular science and medicine right now.
What changes contractility? Chemicals. Any chemical that changes intracellular free calcium, typically either sympathetic neurotransmitters or medications.
When contractility changes, the Starling curve shifts: up, for better stroke volume at a given preload, when contractility is high, and down, for lower stroke volume at a given preload, when contractility is low.
Contractility equals inotropy
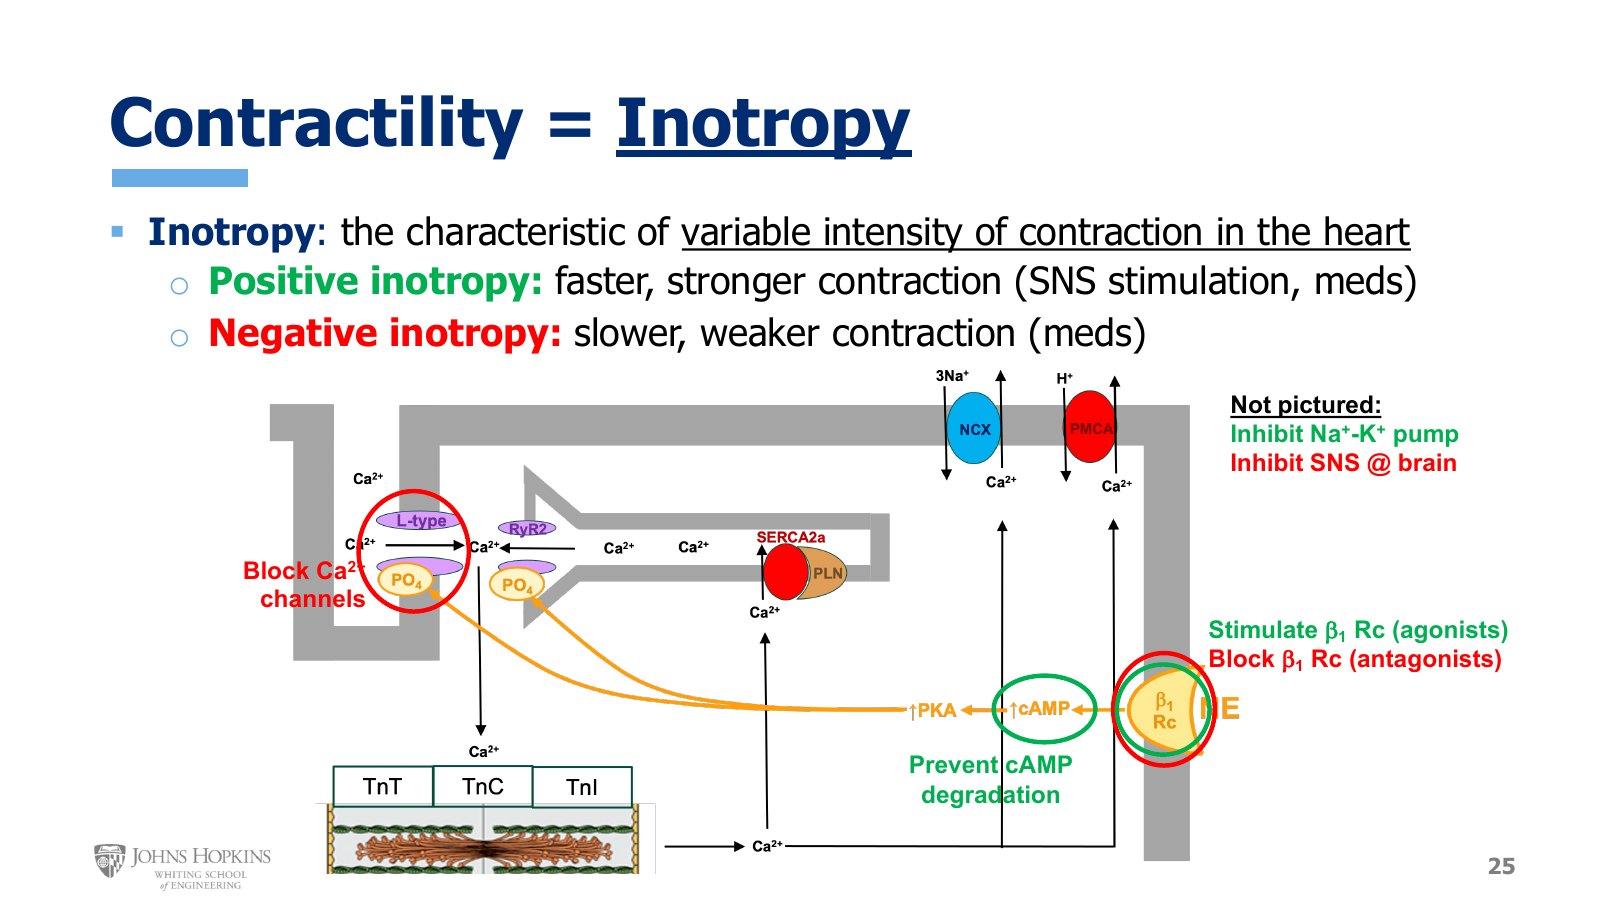
Slide 25. The same myocyte, circled where drugs act. Green for positive inotropes, red for negative.
The final -tropy term for the heart is inotropy, virtually synonymous with contractility: the characteristic of being able to change the intensity of contraction in the heart.
Positive inotropy is synonymous with high contractility, giving faster, stronger contraction. It is typically caused by sympathetic activation or certain medications.
Negative inotropy is synonymous with low contractility, giving slower, weaker contraction. It is typically caused by certain medications.
The figure from lecture 4F shows how sympathetic activation increases the strength of contraction:
Norepinephrine binds beta-1 receptors.
Cyclic AMP increases.
Protein kinase activation increases.
PKA phosphorylates the L-type calcium channels in the cell membrane and the ryanodine receptor calcium release channels on the sarcoplasmic reticulum membrane.
Phosphorylation gives both kinds of channel a higher open probability, so they spend more of their time open.
More open channels means more intracellular calcium accumulating in the cytoplasm, which diffuses to the sarcomere, binds troponin C, increases the number of cross-bridges, and increases force production.
Positive inotropes, medications that produce positive inotropy, can work three ways:
Mimic norepinephrine at beta-1 receptors. These mimicking molecules are beta-1 agonists.
Prevent the degradation of cyclic AMP, so it sticks around longer and activates more PKA for more phosphorylation.
Inhibit the sodium-potassium pump, gradually accumulating Na+ inside the cell. That stimulates sodium-calcium exchangers to export the extra sodium, importing lots of extra calcium in the process.
Negative inotropic medications act at various places on the diagram to decrease the intracellular calcium available to drive contraction:
Inhibit sympathetic activation all the way up in the brain, preventing norepinephrine release in the heart.
Block the beta-1 receptor, preventing norepinephrine from binding. Receptor-blocking drugs are antagonists.
Block the L-type calcium channels in the cell membrane, preventing calcium from flowing into the cell.
The three determinants of stroke volume
Determinant | Relation to SV | Acts on | Surrogate | Changed by | Starling curve |
|---|---|---|---|---|---|
Preload | Proportional | EDV, filling | LV EDV; LV end-diastolic pressure; atrial pressures | Volume | Operating point moves along it |
Afterload | Inverse | ESV, emptying | Mean arterial blood pressure | Pressure | Shifts down when high, up when low |
Contractility | Proportional | ESV, emptying | ESPVR (EF and dP/dt max are poor) | Chemicals | Shifts up when high, down when low |