9E · Integration of Cardiac and Vascular Function
This lecture graphically joins the cardiac and vascular compartments to determine the cardiovascular operating point at any given moment. That requires first reviewing what we already know about each, starting with the cardiac side.
Cardiac output review
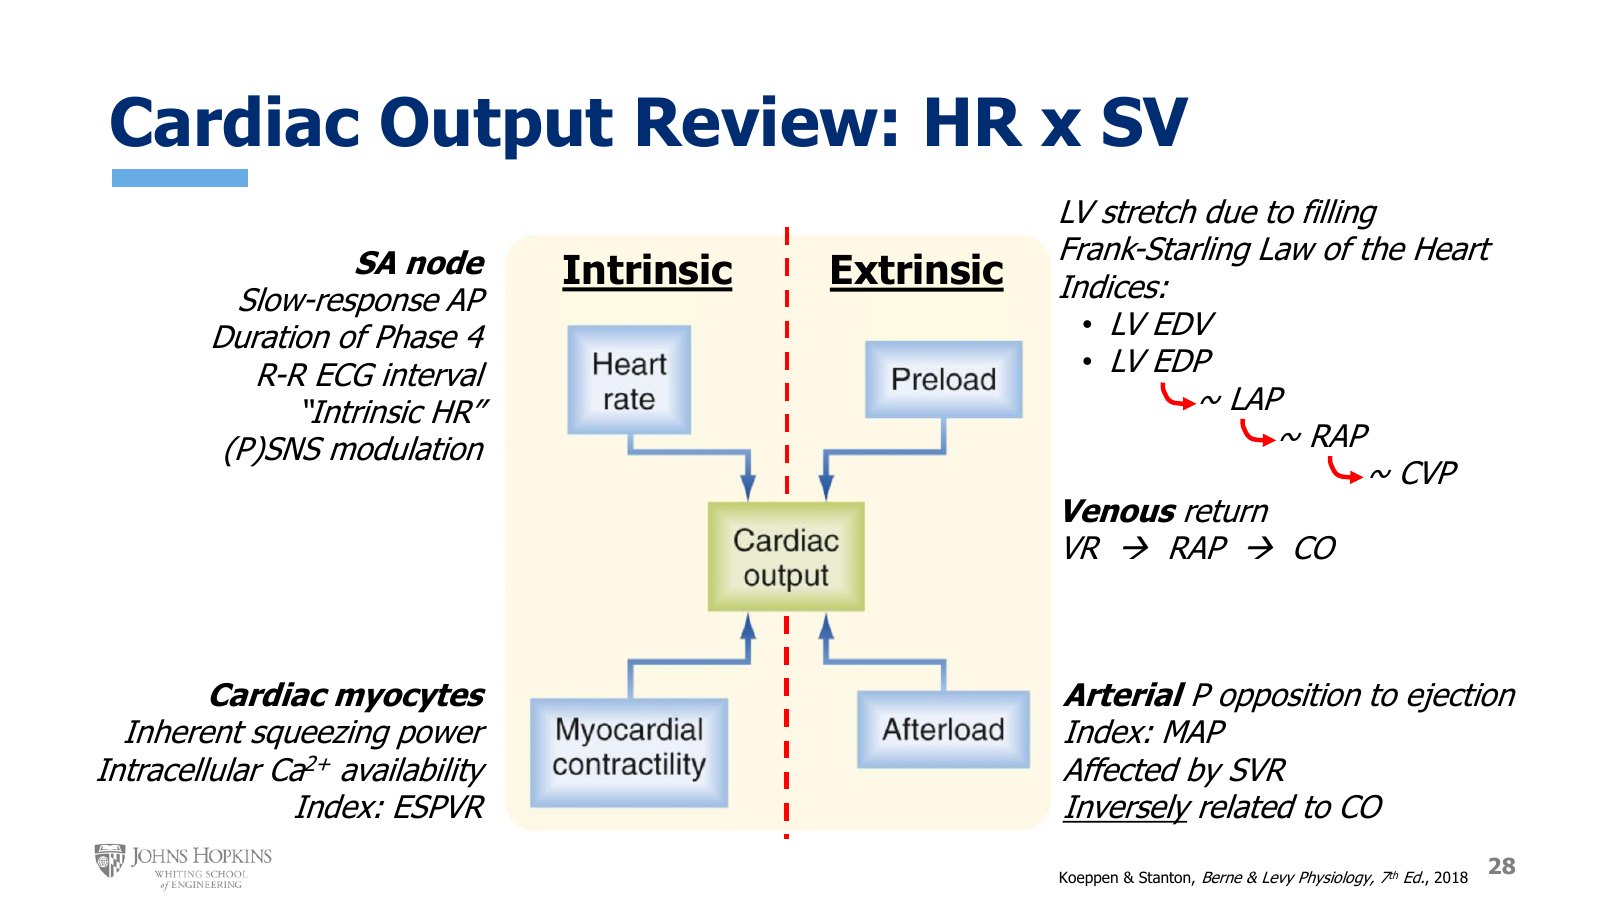
Slide 28. The four determinants of cardiac output split by a dashed line. Heart rate and contractility are intrinsic. Preload and afterload are extrinsic. Notes beside each box give its source and index.
We have four major determinants of cardiac output, or cardiac function: heart rate, plus the three determinants of stroke volume, which are preload, afterload, and contractility. These split nicely into intrinsic factors, which originate within cardiac tissue, and extrinsic factors, which originate outside it.
Heart rate, intrinsic. Heart rate is driven by the rate of depolarization at the SA node, making it an intrinsic characteristic of the heart. The SA node action potential is a slow-response waveform, where the duration of phase 4 determines the time between heartbeats and so heart rate. The time between heartbeats also appears on an ECG tracing as the R to R interval, the time between two adjacent R waves. Intrinsic heart rate is set exclusively by the SA node, which determines on its own the baseline rate at which it depolarizes, although sympathetic and parasympathetic input can modulate and tweak it.
Contractility, intrinsic. Contractility resides in the cardiac myocytes themselves, as their inherent contractile strength changes with intracellular calcium availability. The best index for representing and quantifying contractility is the end-systolic pressure-volume relationship, which can be illustrated on a left ventricular pressure-volume loop.
Preload, extrinsic. Preload is the stretch on the ventricular wall at the end of diastolic filling. It is directly correlated with stroke volume, as the Frank-Starling law of the heart states: high preload gives stronger contraction and higher stroke volume, and lower preload gives weaker contraction and lower stroke volume. We use several surrogate indices, or predictors, of stretch and so preload:
left ventricular end-diastolic volume, or end-diastolic pressure
left atrial pressure, which is very close to left ventricular pressure at the end of diastole
right atrial pressure, because the left and right atria experience very similar pressures
central venous pressure, because CVP and right atrial pressure are virtually identical
Each pressure gets one step further removed from the left ventricle, but all of these measurements are still solid predictors of ventricular filling and stretch, and all are valid indices of preload.
Preload is extrinsic because control over filling ultimately lies in a vascular, not cardiac, compartment. It originates on the venous side of the circulation; note central venous pressure as an index of preload. Venous return flow rates determine how much blood enters the heart and so how much blood can fill it. Taking it a step further, preload explicitly ties venous return to cardiac output. Venous return, the flow rate of blood into the heart, determines right atrial filling and so right atrial pressure. Right atrial pressure, as the index of preload, then determines cardiac output, the flow rate of blood out of the heart.
Inflow is coupled to outflow, with preload serving as the coupling factor.
Afterload, extrinsic. Afterload is the opposition the left ventricle faces as it tries to eject blood. In the absence of valve disease, arterial pressure, a vascular, non-cardiac characteristic, is the usual source of that opposition. So we typically use mean arterial pressure as the surrogate measurement of afterload, and changes in systemic vascular resistance strongly influence arterial pressure and so afterload.
The cardiac function curve
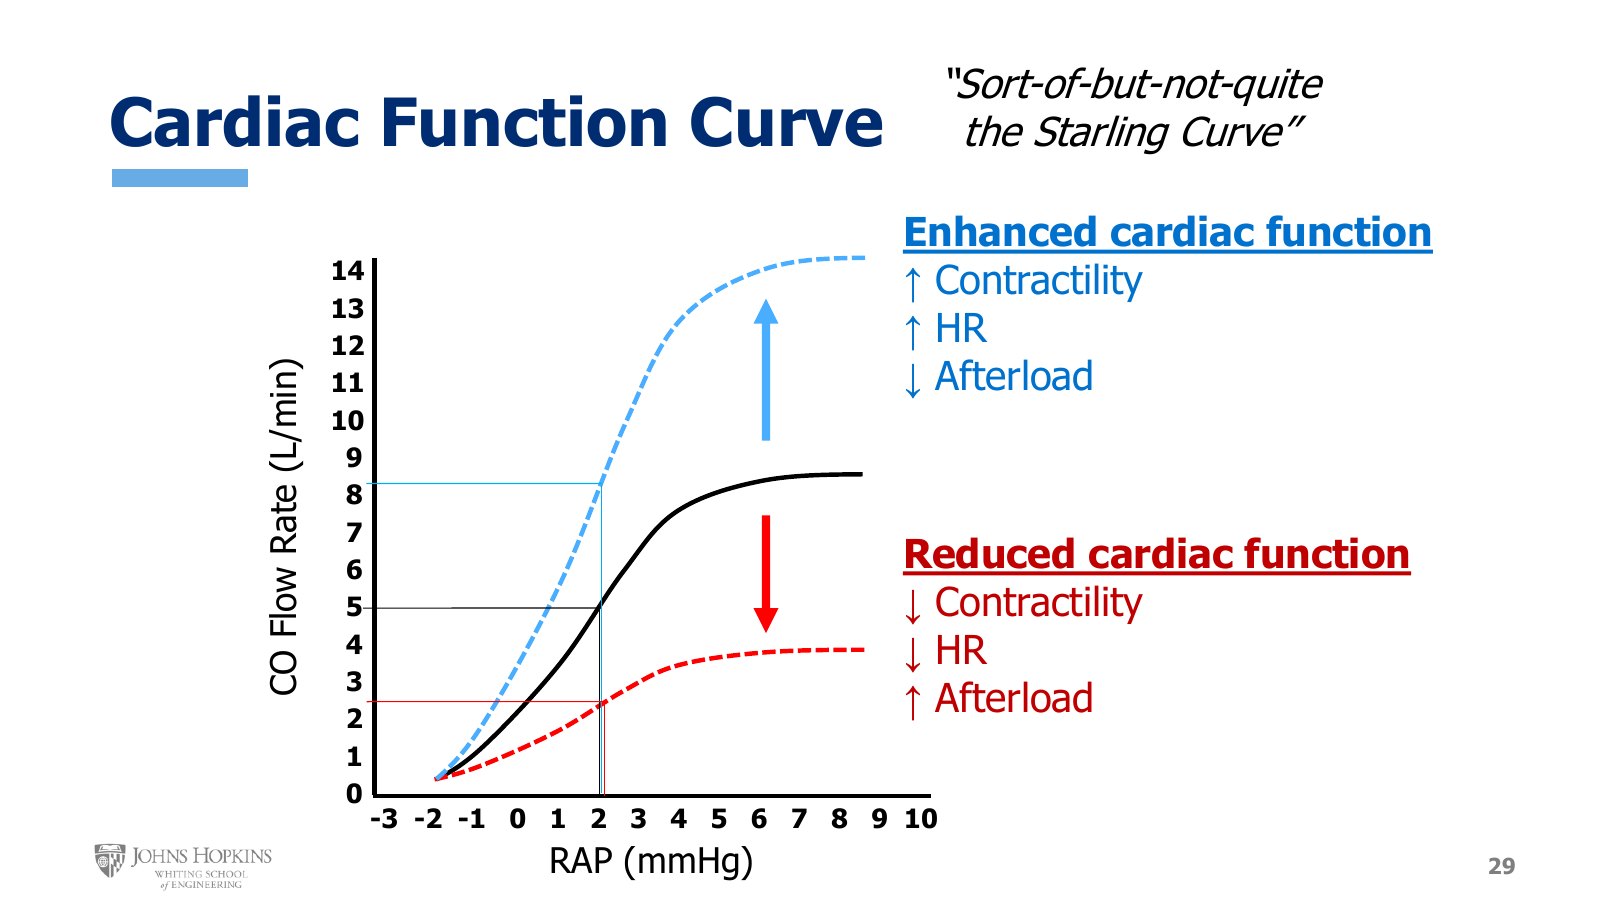
Slide 29. Cardiac output against right atrial pressure. At 2 mmHg the baseline curve gives 5 L/min, the enhanced curve a little over 8, and the reduced curve about 2.5. The slide calls it the sort-of-but-not-quite Starling curve.
Putting the four determinants of cardiac output into graphical form, where cardiac function can be assessed just by looking at a graph, gives this. It looks a lot like the Starling curve and is very similar, but not quite the same. The x-axis still holds an index of preload, right atrial pressure. The y-axis holds cardiac output, not stroke volume. That makes this a cardiac function curve.
Preload is easy to place: it is the x-axis. Moving horizontally across the graph changes preload, and the height of the curve shows cardiac output rising or falling with it.
Contractility, heart rate, and afterload show up as the curve shifting up or down.
Upward shift: enhanced cardiac function, higher cardiac output for a given preload. This occurs with higher contractility, higher heart rate, or lower afterload. The greater the upward shift, the greater the enhancing effect of these three factors.
Downward shift: reduced cardiac function, lower cardiac output for a given preload. This occurs with lower contractility, lower heart rate, or higher afterload. The more pronounced the depression of the curve, the more function has been lost.
Note the arrangement of the variables. Right atrial pressure, the index of preload, is the independent variable on the x-axis, and cardiac output is the dependent variable on the y-axis. That reflects the cause-and-effect relationship above: preload drives cardiac output.
Building a venous return curve
Now for vascular function. A vascular function curve is not something we have built yet this semester, so we take it slow and derive it through a physiological thought experiment.
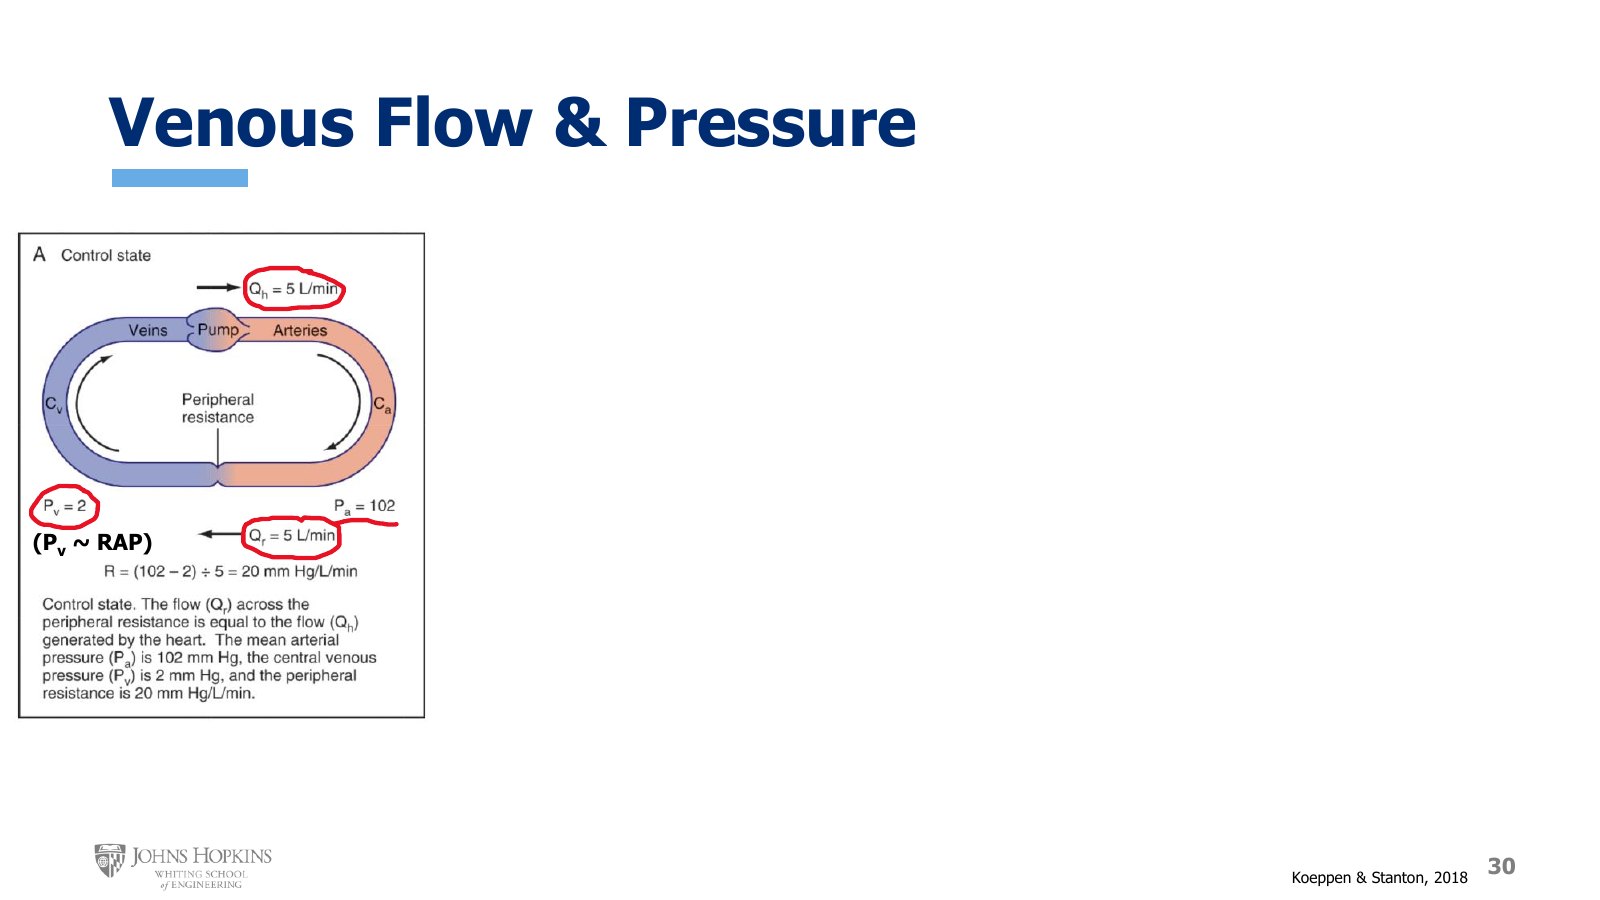
Slide 30. Panel A, the control state of the pump and circulation. Pump and arteriolar flow are both 5 L/min, arterial pressure 102 mmHg, and venous pressure 2 mmHg, noted as roughly right atrial pressure.
Picture a pump and circulation set up in the lab. The pump is at the top of the circuit, the arterial side of the circulation on the right in red, the resistance arterioles as the pinch point at the bottom, and the venous side on the left in blue, returning to the pump.
Under normal baseline conditions, pump outflow rate is 5 L/min, and so is the flow rate a bit downstream through the arterioles. Mean arterial pressure is 102 mmHg, and central venous pressure, which is very similar to right atrial pressure, is 2 mmHg.
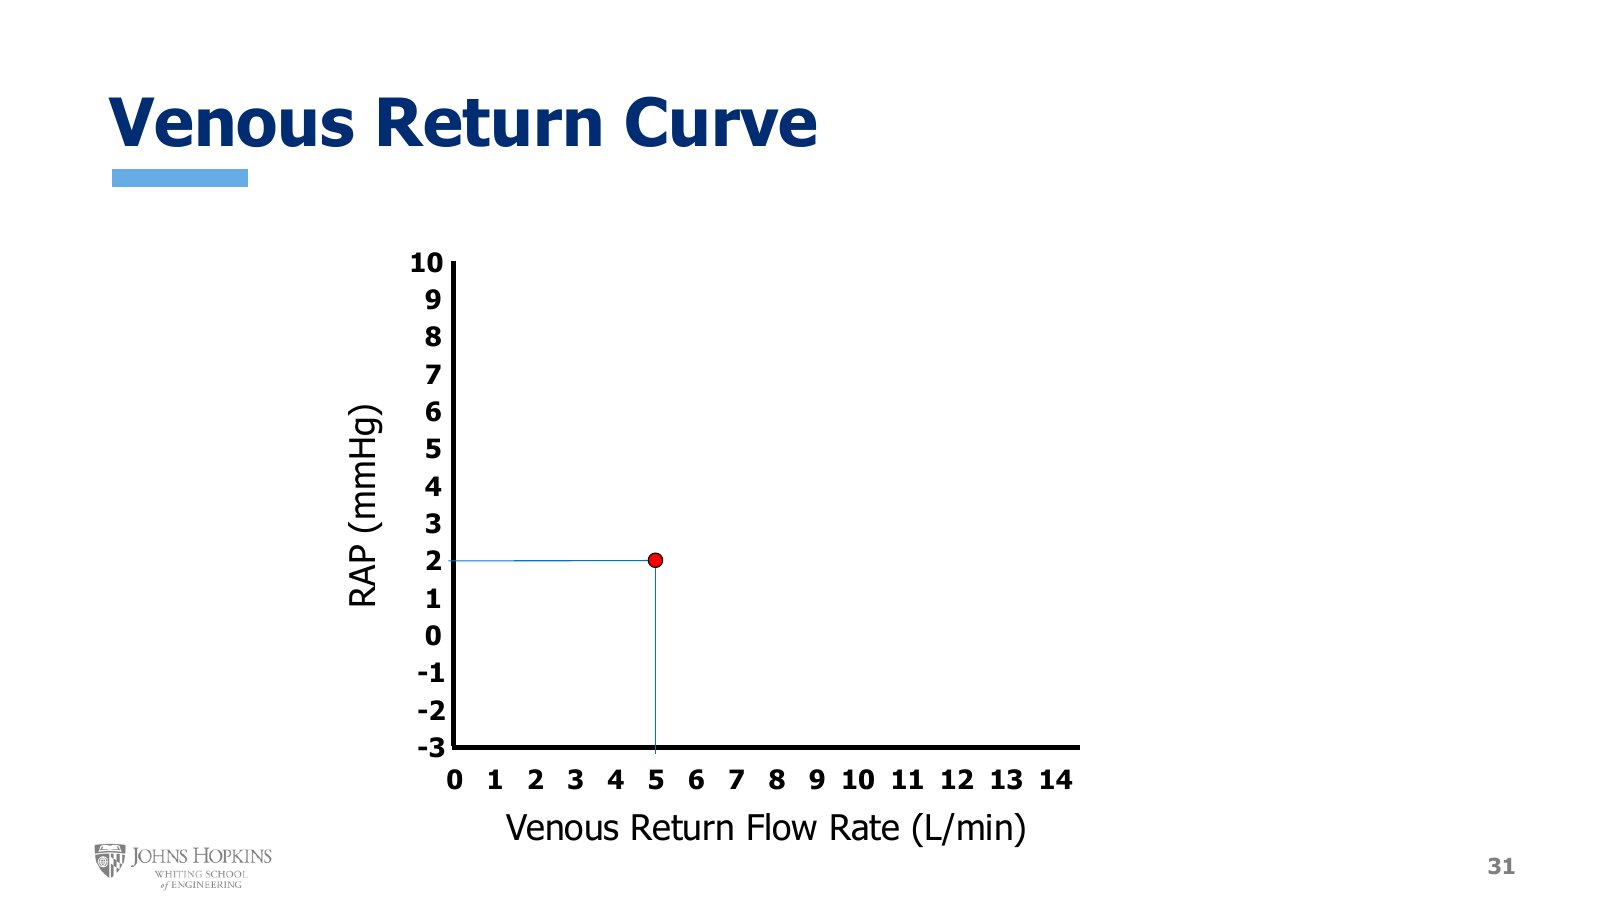
Slide 31. An empty venous return graph, right atrial pressure against venous return flow rate, with one baseline point at 5 L/min and 2 mmHg.
That flow and pressure data goes onto a vascular function curve, or venous return curve. The x-axis is flow rate returning to the pump, venous return flow rate. The y-axis is right atrial pressure, standing in for venous pressure since CVP and right atrial pressure are so similar.
Note the arrangement of the variables. Venous return flow rate is the independent variable on the x-axis and right atrial pressure the dependent variable on the y-axis. That reflects the cause-and-effect relationship above: venous return drives right atrial filling and pressure.
From the baseline condition, a systemic flow rate of 5 L/min and a venous, and so right atrial, pressure of 2 mmHg give a baseline data point. With one data point there is no telling what the curve looks like. We need more data.
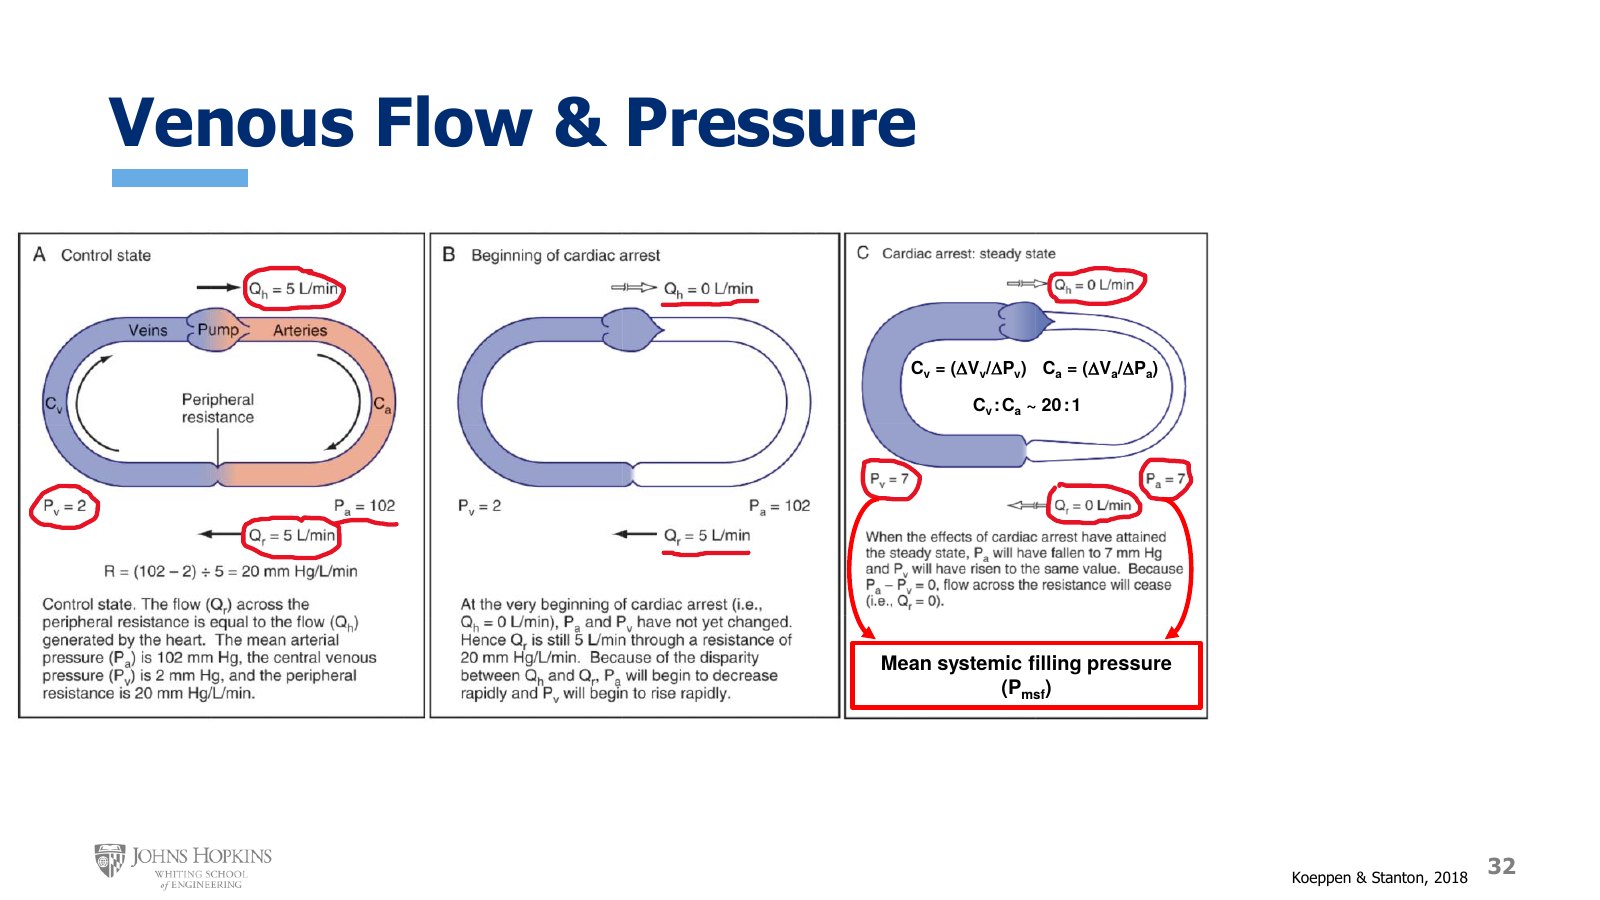
Slide 32. Panels A to C. At the beginning of cardiac arrest, pump flow is zero but arteriolar flow is still 5 L/min. At steady state both pressures reach 7 mmHg, the mean systemic filling pressure, with Cv to Ca about 20 to 1.
Back to the pump. Stop it completely: cardiac arrest. Right after the pump stops, flow entering the circulation is now 0 L/min. But the arterial side still contains some blood volume and has some elasticity, so arterial elastic recoil inward still produces a flow downstream at the arterioles, still 5 L/min.
Keep waiting for everything to settle into a no-flow state throughout the system. Blood volume passively redistributes itself until there is no more pressure gradient between the arterial and venous sides. No more drive for blood to move anywhere. Complete stasis. The vast majority of blood volume has now shifted into the very compliant venous side, with very little left in the less compliant arterial side.
The decrease in arterial blood volume decreased arterial pressure from 102 mmHg to 7 mmHg.
The increase in venous blood volume increased venous pressure from 2 mmHg to 7 mmHg.
When there is no flow and pressure has reached equilibrium throughout the entire circulation, that pressure is called the mean systemic filling pressure.
A significant portion of blood volume shifted from the arterial side to the venous side, so the arteries lost the same volume the veins gained. Yet the pressure changes are very unequal. Arterial pressure decreased by 95 mmHg while venous pressure increased by only 5. The reason is compliance, the relationship between volume and pressure. Venous compliance is much greater than arterial compliance, so the veins undergo a much smaller change in pressure for a given change in volume. Running the numbers from this exercise:
The same volume ΔV appears in both compliances and cancels. Venous compliance is almost 20 times greater than arterial compliance.
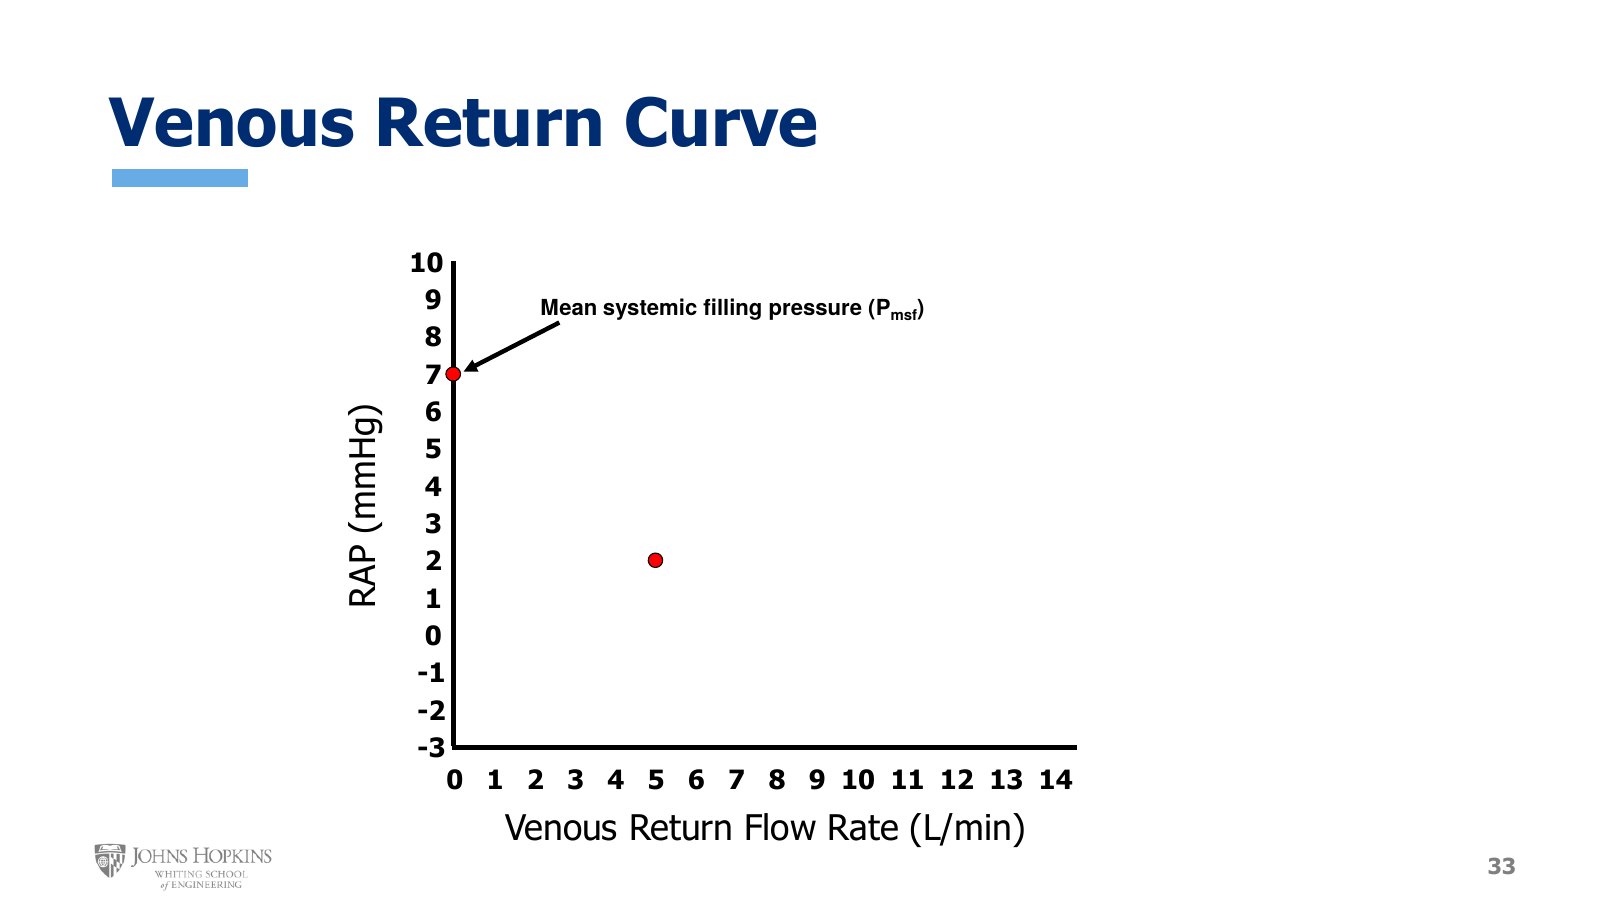
Slide 33. The no-flow point added at 0 L/min and 7 mmHg, labeled mean systemic filling pressure, above the baseline point.
Plot the no-flow data. At a venous return flow rate of 0 L/min, venous and so right atrial pressure is 7 mmHg. It is labeled mean systemic filling pressure as a reminder of what this particular point signifies.
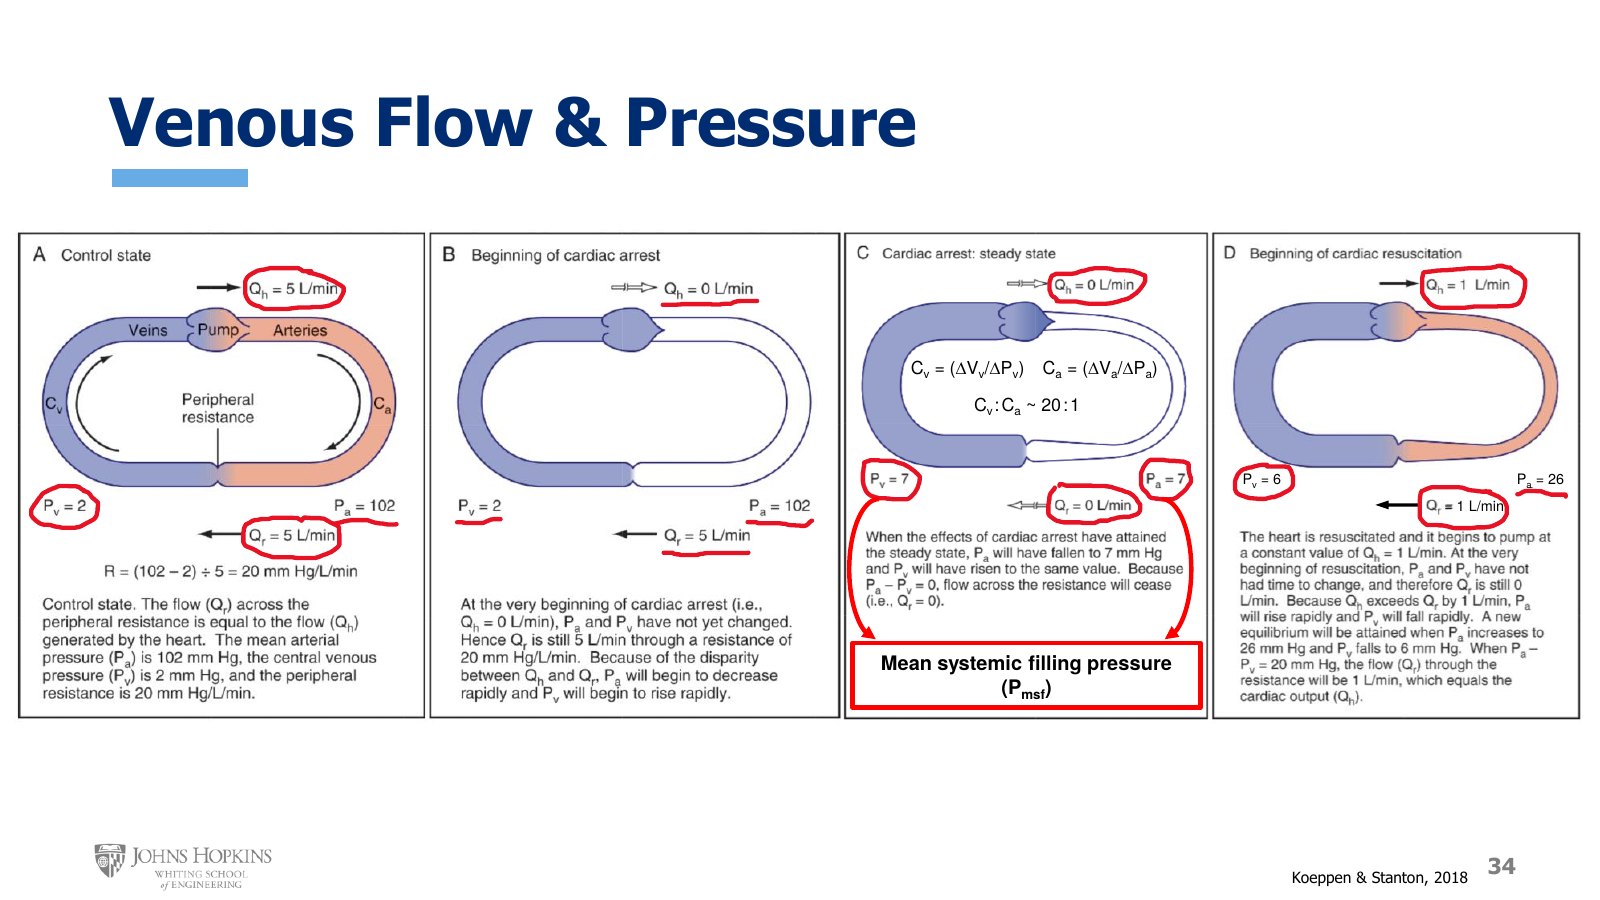
Slide 34. Panel D added. Resuscitation at a constant 1 L/min brings arterial pressure up to 26 mmHg and venous pressure down to 6 mmHg.
One more data point. Start the pump up again, very gradually, going for a systemic flow rate of just 1 L/min. Once the pump has run at that rate for a little while and the system reaches a new steady state, arterial pressure has increased from 7 up to 26 mmHg, while venous pressure has decreased from 7 to 6 mmHg.
Plot it: the new steady-state systemic flow rate of 1 L/min means venous return is 1 L/min, giving a venous and so right atrial pressure of 6 mmHg. That is a third data point.
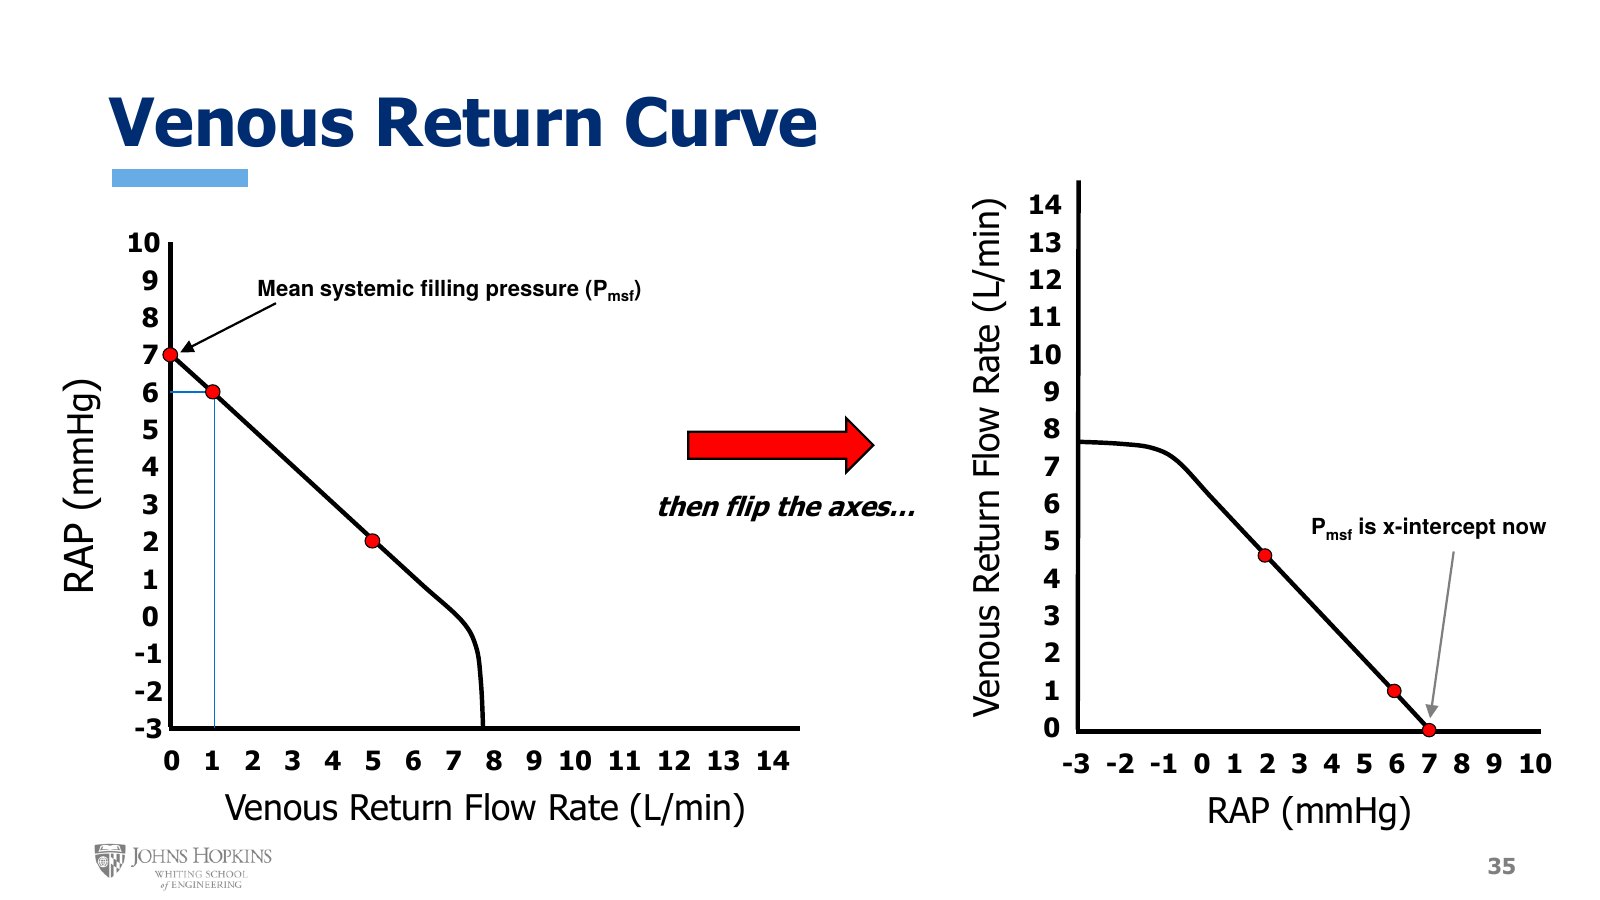
Slide 35. Left, the three points joined into a line that falls from 7 mmHg at zero flow and turns vertical near 7.5 to 8 L/min. Right, the same curve with axes flipped, so mean systemic filling pressure becomes the x-intercept at 7 mmHg.
Continuing this exercise for another few iterations gives a venous return curve that looks like this: linear until the flow rate reaches around 7.5 to 8 L/min.
It would be nice to see the vascular and cardiac function curves at the same time, maybe even on the same graph. Both plot pressure and flow rate, except for one small detail: right atrial pressure is on the x-axis of the cardiac curve but on the y-axis of the vascular curve. The solution is to flip the axes of the venous return curve so right atrial pressure is on the x-axis here too, so this graph can be superimposed over the cardiac function graph.
Venous return curve shifts
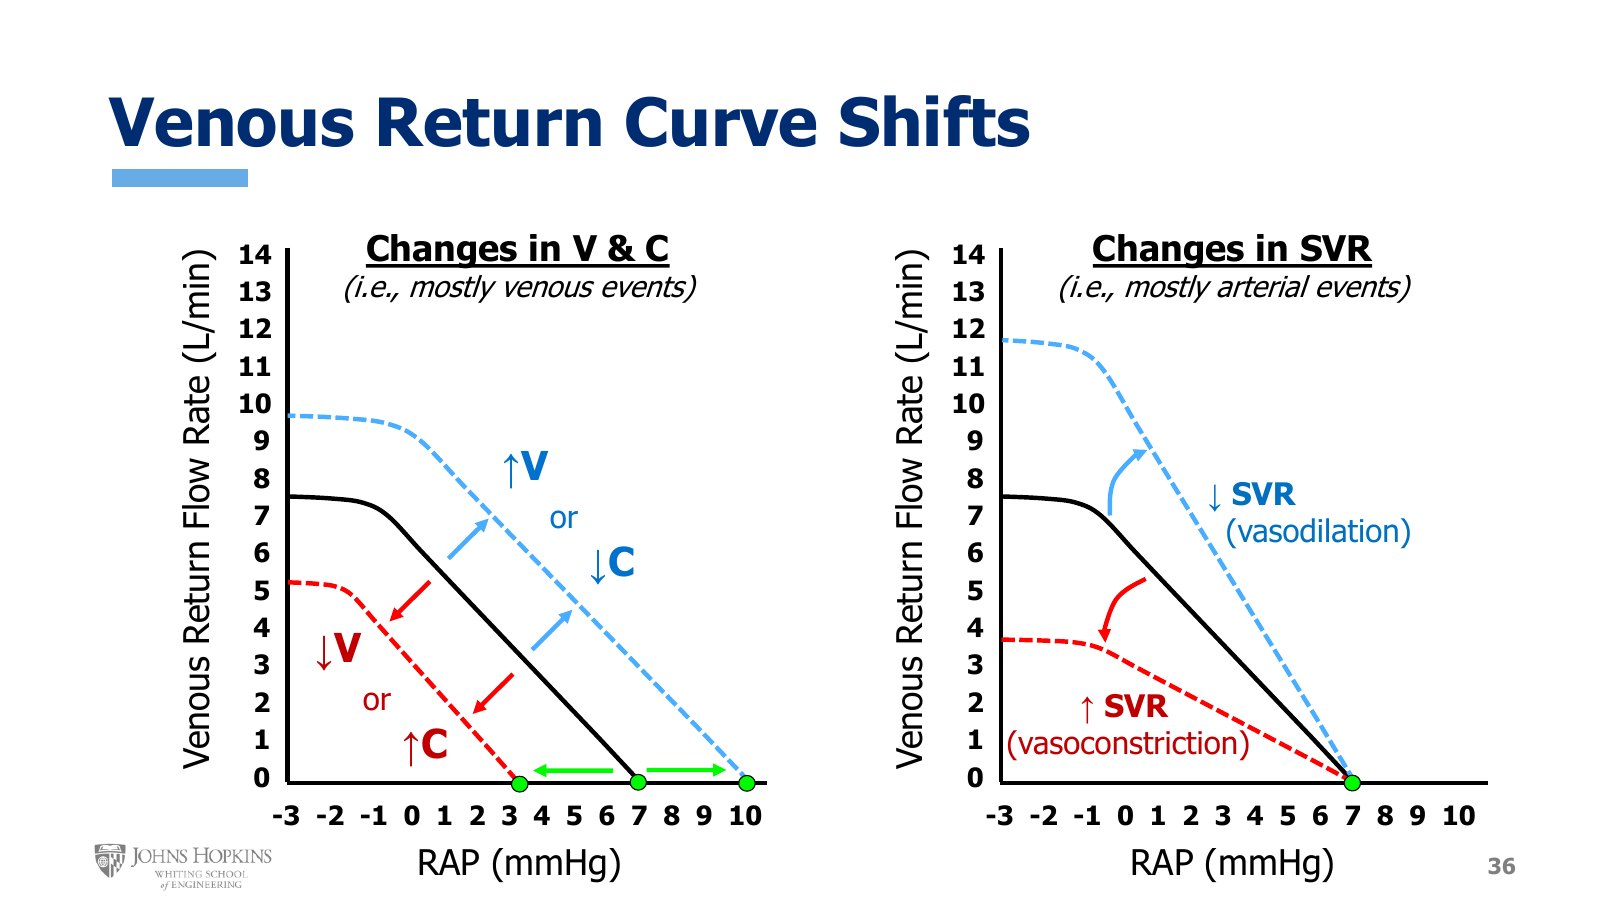
Slide 36. Left, volume and compliance changes shift the curve in parallel, moving the x-intercept from 7 to about 10 or about 3 mmHg. Right, resistance changes pivot the slope around the fixed 7 mmHg intercept.
Just as the cardiac function curve shifts with the predictors of cardiac output, the venous return curve shifts depending on what else is going on in the vasculature.
Changes in blood volume or vascular compliance. Blood volume and compliance are significant venous characteristics, so think of this as the mostly venous events shift. Changing blood volume or vascular compliance produces a pattern of parallel shifting.
Blood volume increases or compliance decreases, both of which make the veins feel more full: a parallel shift up and to the right, which also increases mean systemic filling pressure.
Blood volume decreases or compliance increases, both of which make the veins feel more empty: a parallel shift down and to the left, which also decreases mean systemic filling pressure.
In both directions, the magnitude of the change in volume or compliance sets the magnitude of the shift.
Changes in systemic vascular resistance. Resistance is mostly an arterial phenomenon, particularly an arteriolar one, so think of this as the mostly arterial events shift. Changing systemic vascular resistance changes the slope of the venous return curve, pivoting around a fixed mean systemic filling pressure x-intercept.
Vasodilation, so decreased systemic vascular resistance: a steeper slope.
Vasoconstriction, so increased vascular resistance: a flatter slope.
Much as the parallel shifts track the size of the volume or compliance change, the slope shifts track the size of the resistance change. A large change in vascular resistance gives a more dramatic change in slope, and a smaller change gives a smaller, more subtle one.
Cardiac and venous return curves together: the operating point
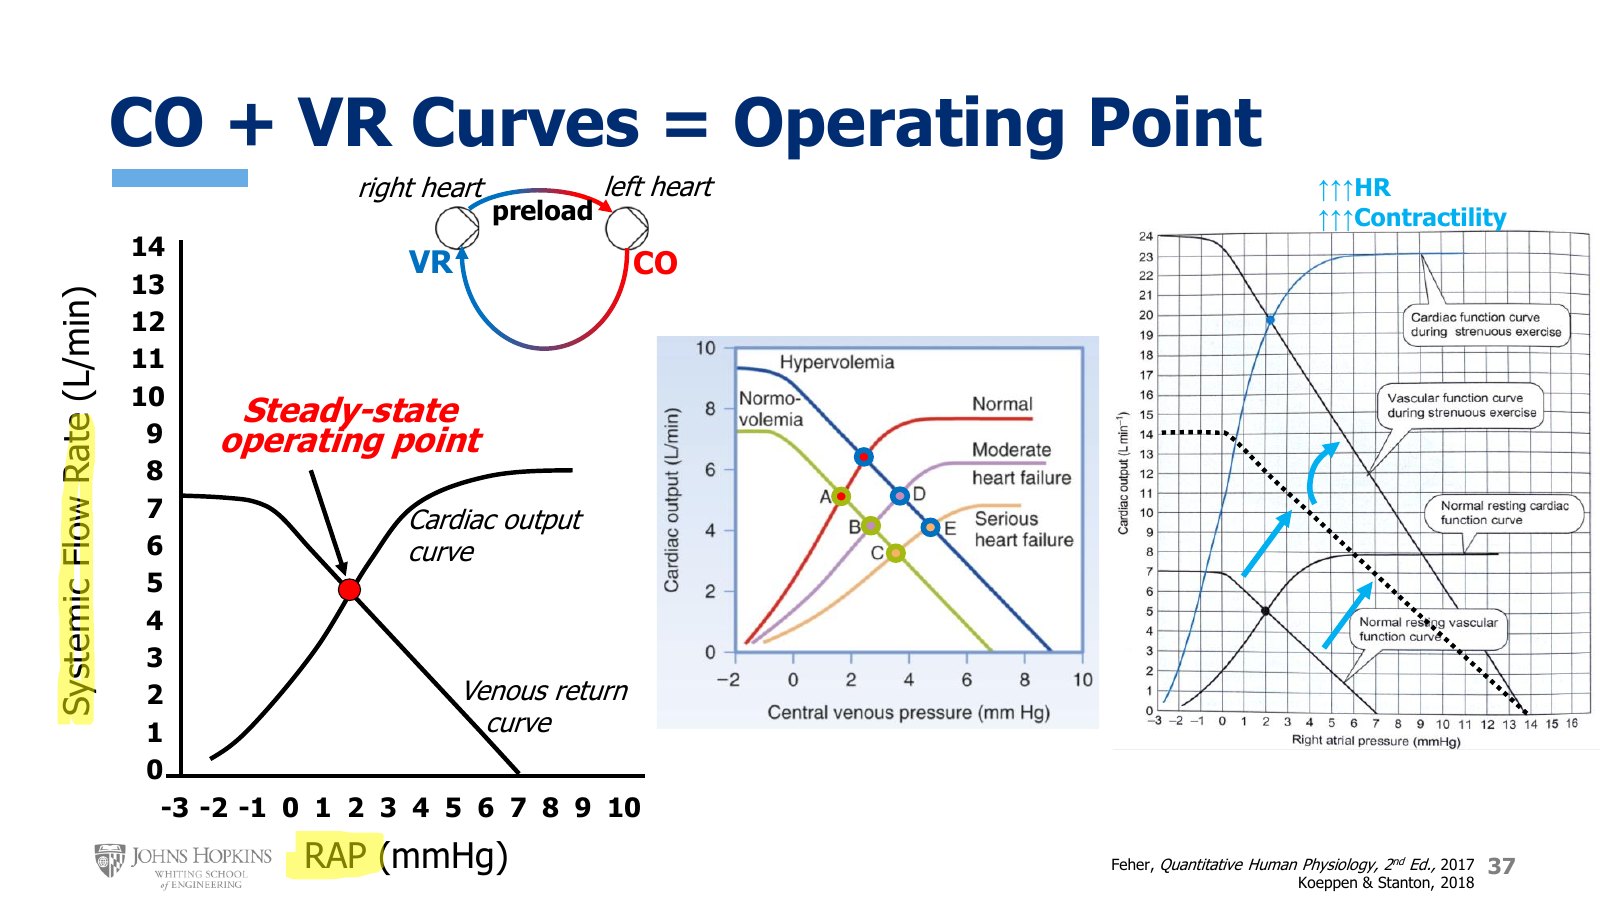
Slide 37. Left, baseline curves crossing at the steady-state operating point. Center, normovolemia and hypervolemia curves against normal, moderate, and serious heart failure curves. Right, strenuous exercise moves the operating point from about 5 to about 20 L/min with right atrial pressure near 2 mmHg.
Here the baseline cardiac and venous return curves are superimposed on the same graph. Right atrial pressure is the common x-axis variable. The y-axis is simply systemic flow rate, because cardiac output and venous return are both systemic flow rates, one as flow leaves the heart and the other as flow returns to it. The two flow rates are coupled, so they must be the same under steady-state conditions. Venous return drives preload, which after blood travels through the pulmonary circulation drives cardiac output. Cardiac output, after blood travels through the systemic circulation, drives venous return.
The point where the two curves intersect is the steady-state operating point for the system under those particular conditions at that particular moment. Under fairly normal baseline conditions, we operate at a right atrial pressure of 2 mmHg with venous return and cardiac output at 5 L/min.
Curve shifts. When curves shift, still look at where the two intersect. The center graph shows both cardiac and vascular curve shifts. The green line is the normal vascular curve and the red line the normal cardiac curve, giving a normal operating point of 2 mmHg and 5 L/min.
Moderate heart failure. The cardiac function curve depresses downward. The new operating point has right atrial pressure a little higher, around 3 mmHg, while systemic flow rate has decreased to 4 L/min.
More intense heart failure. The cardiac curve depresses even further. Right atrial pressure is now almost 4 mmHg, with systemic flow down around 3 L/min.
More blood volume, normal heart (the blue line). Right atrial pressure increases to maybe 2.5 mmHg, while systemic flow rate increases to a little over 6 L/min.
More blood volume plus moderate heart failure. Right atrial pressure is almost 4 mmHg and systemic flow rate 5 L/min. A bit like the baseline condition, just farther to the right.
More blood volume plus more serious heart failure. Right atrial pressure continues to increase, up to 5 mmHg, while systemic flow rate continues to decrease, down to 4 L/min.
Operating points from the heart failure and blood volume graph
Condition | Right atrial pressure | Systemic flow |
|---|---|---|
Normal volume, normal heart | 2 mmHg | 5 L/min |
Normal volume, moderate heart failure | ~3 mmHg | 4 L/min |
Normal volume, more intense heart failure | almost 4 mmHg | ~3 L/min |
More volume, normal heart | ~2.5 mmHg | a little over 6 L/min |
More volume, moderate heart failure | almost 4 mmHg | 5 L/min |
More volume, serious heart failure | 5 mmHg | 4 L/min |
Everything changing at once: exercise. The right graph shows what this looks like when cardiac, venous, and arterial factors all change at the same time. It compares baseline conditions with intense whole-body aerobic exercise like running, swimming, or cycling, which involves high levels of sympathetic nerve activity and lots of metabolic vasodilation.
The cardiac function curve shifts up dramatically, because of the much higher heart rates and myocardial contractility seen during exercise.
The vascular curve also shifts dramatically, in two ways. First, an intermediate parallel shift up and to the right, from a decrease in venous compliance through sympathetic venoconstriction. Second, a slope shift to a steeper slope, from the overall net systemic vasodilation. That is mostly a huge degree of metabolic vasodilation in the exercising muscle vascular beds, which overwhelms the sympathetic vasoconstriction in other parts of the body.