3D · Muscle Metabolism and Fiber Types
Where the ATP goes
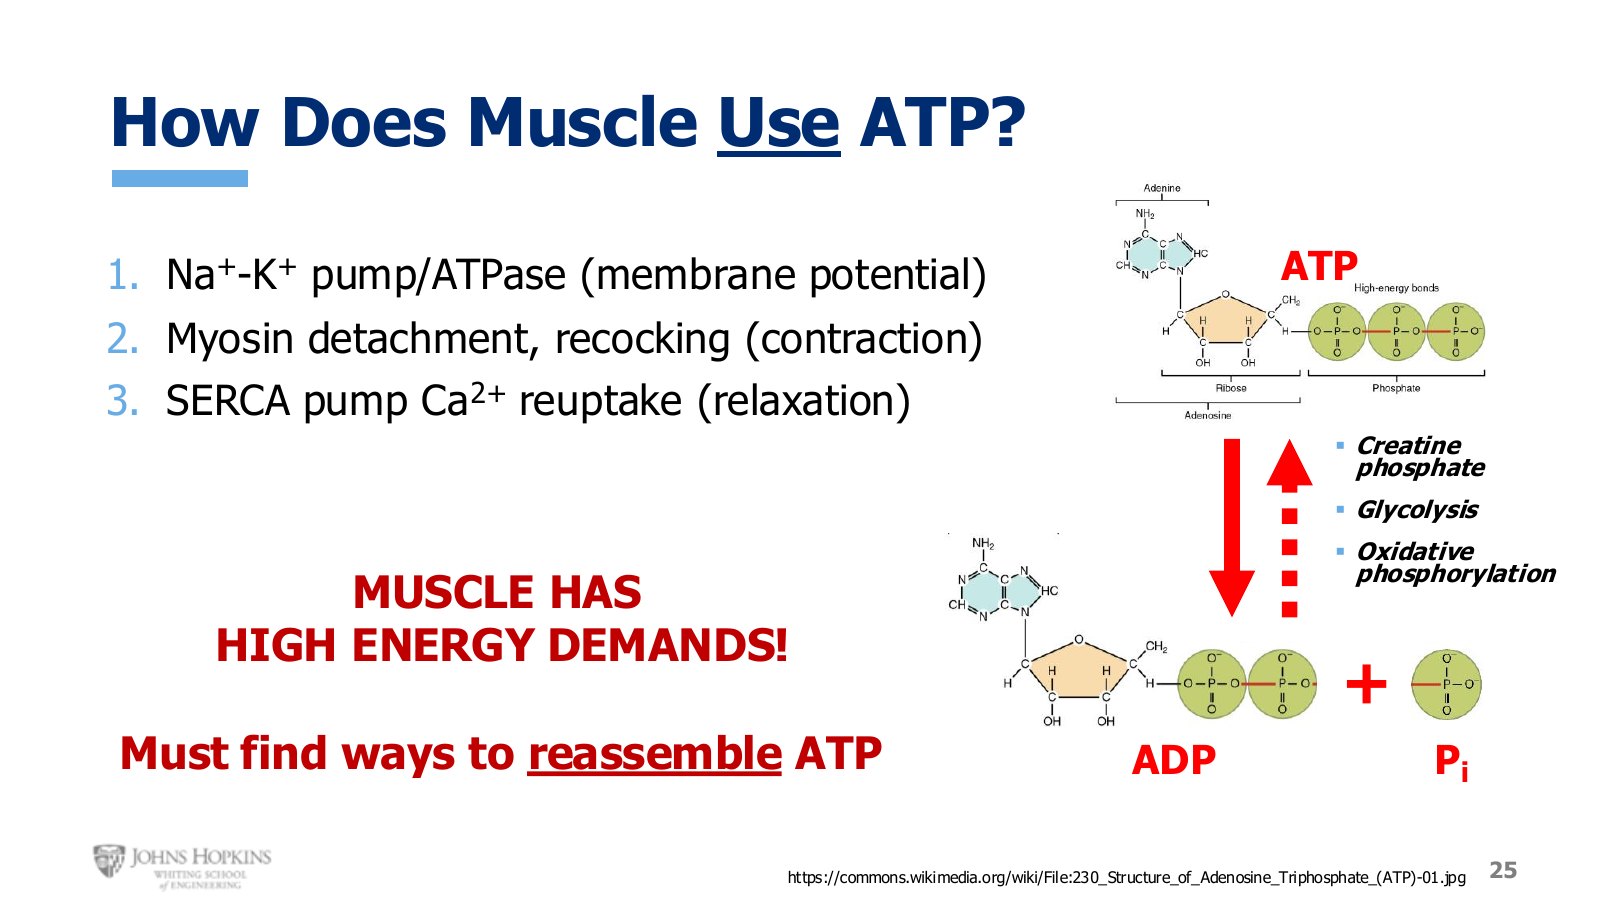
Slide 25. Three ATP sinks in a muscle cell, and the three pathways that refill the supply.
Sodium-potassium pumps in the cell membrane, which establish and maintain resting membrane potential.
Myosin detachment and recocking during contraction.
The SERCA pump during relaxation, transporting calcium up its gradient back into the sarcoplasmic reticulum.
Muscle cells therefore need a steady supply of ATP essentially all the time, continually hydrolyzing adenosine triphosphate into adenosine diphosphate plus the inorganic phosphate cleaved off. Which means they need ways to reassemble ADP and phosphate back into ATP. There are three.
The three pathways
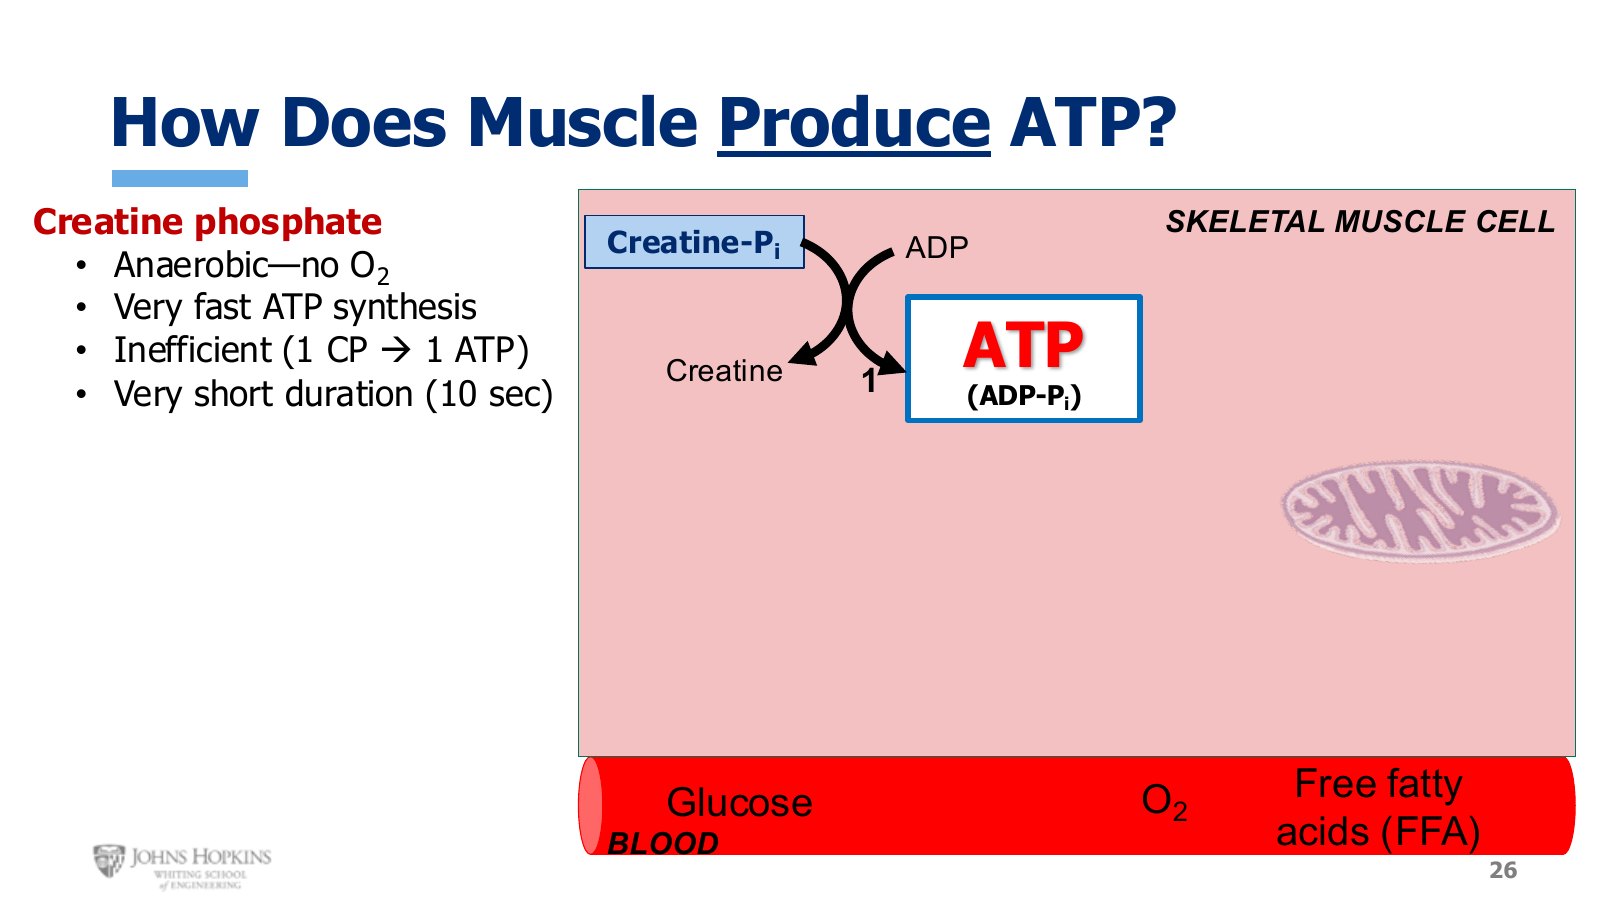
Slide 26. Creatine phosphate alone: one step, anaerobic, very fast, 1 ATP, about 10 seconds.
Creatine phosphate is a one-step process. Creatine phosphate is a high-energy molecule like ATP, holding energy in the bond between the creatine and the phosphate ion, but the body is not designed to run on it directly. So the high-energy bond is broken, releasing energy and the phosphate ion, and that energy is used to attach the phosphate to ADP. The high-energy phosphate bond is simply transferred.
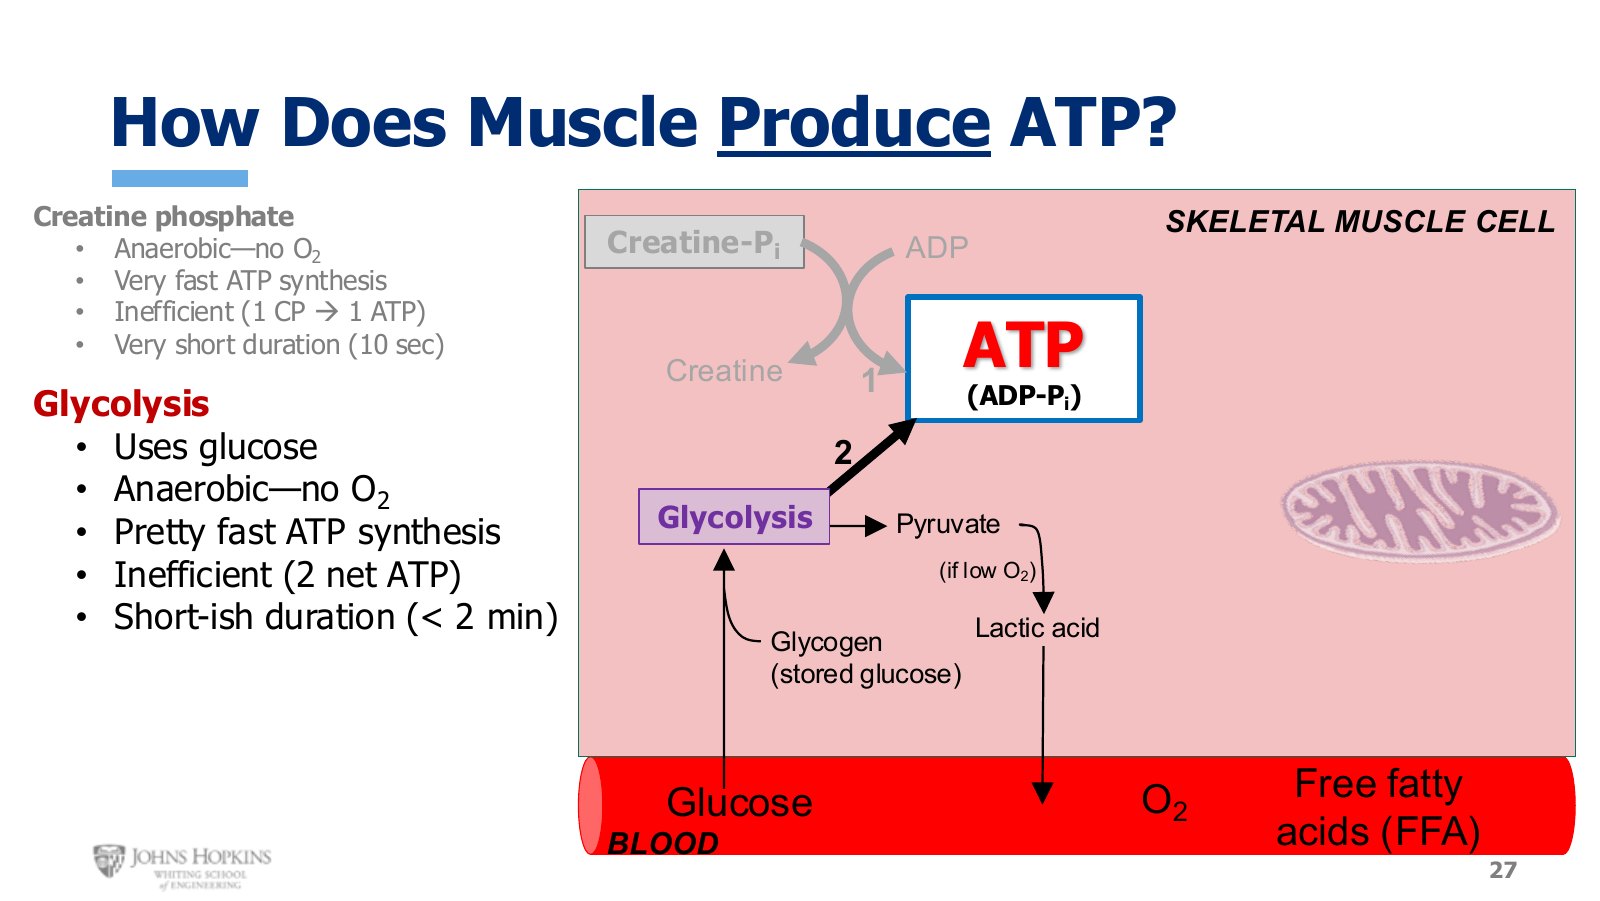
Slide 27. Glycolysis added: glucose or glycogen to pyruvate, 2 net ATP, and lactic acid when oxygen runs low.
Glycolysis uses glucose from the bloodstream or stored glycogen inside the cell. A few short enzymatic steps in the cytoplasm yield a net two ATP per glucose, plus a byproduct called pyruvate.
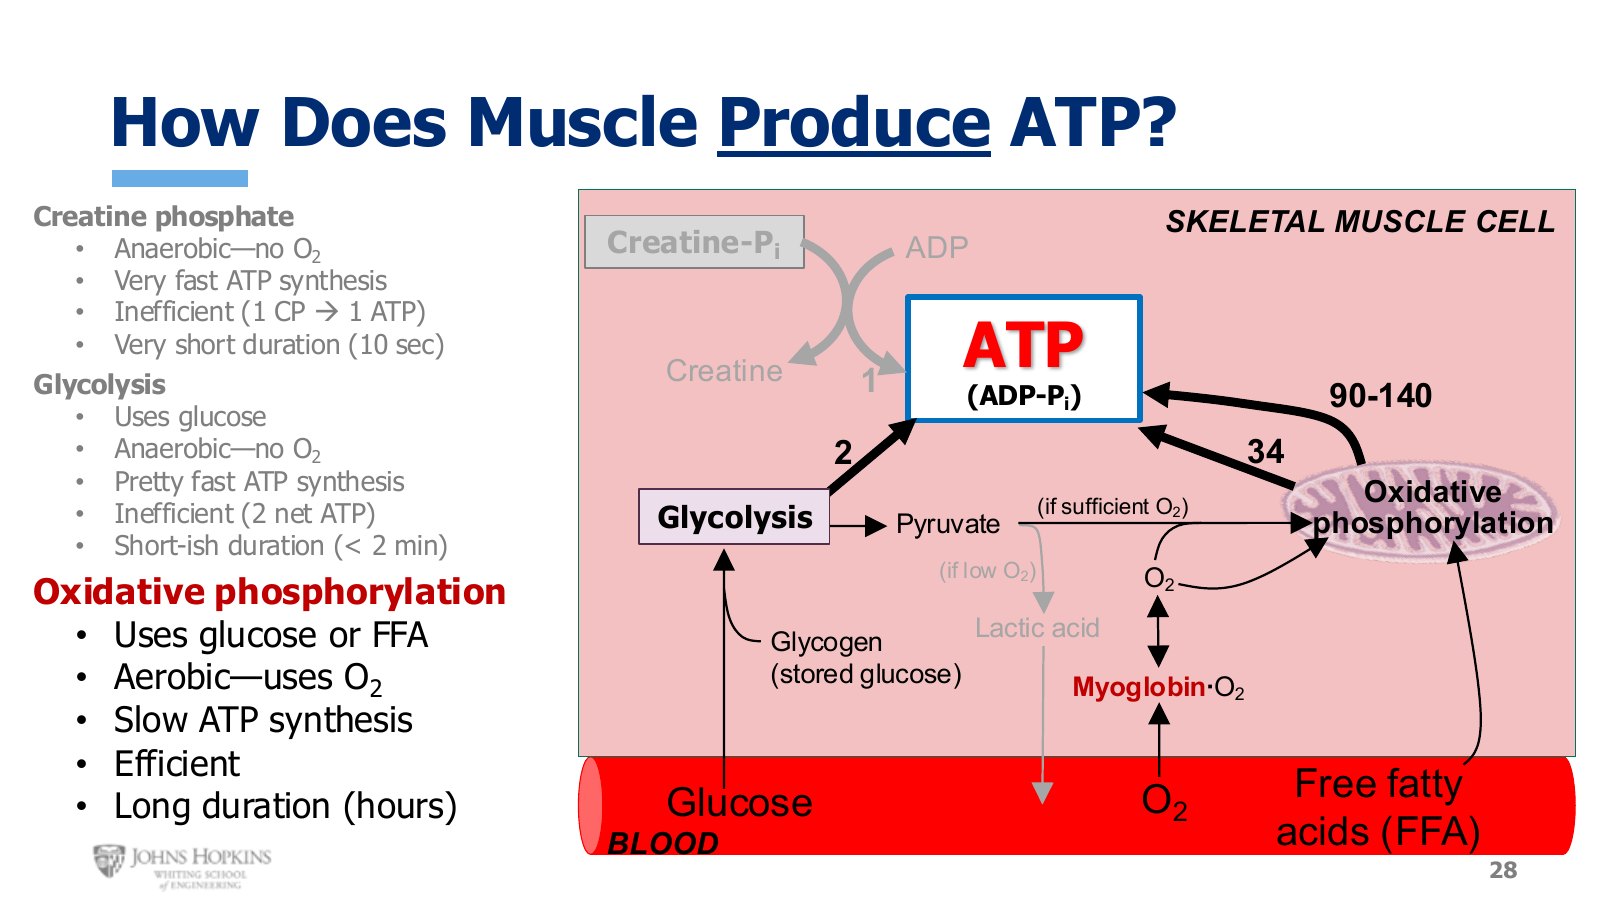
Slide 28. All three pathways on one diagram, with myoglobin, the mitochondria, and the ATP yield of each.
Oxidative phosphorylation uses either glucose or free fatty acids. Glucose goes through glycolysis first, but if sufficient oxygen is available, pyruvate flows into the Krebs cycle and then the electron transport chain, both in the mitochondria. Oxygen arrives by diffusing out of the blood, and inside the cell myoglobin binds oxygen and serves as a reservoir, releasing it when more is needed.
The three ATP pathways compared
Pathway | Substrate | Oxygen | Speed | Yield | Duration |
|---|---|---|---|---|---|
Creatine phosphate | Creatine phosphate | Anaerobic | Very fast | 1 ATP | ~10 s |
Glycolysis | Glucose | Anaerobic | Pretty fast | 2 net ATP | < 2 min |
Oxidative phosphorylation | Glucose | Aerobic | Slow | 34 ATP | hours |
Oxidative phosphorylation | Free fatty acids | Aerobic, more so | Slowest | 90–140 ATP | indefinite |
Creatine phosphate is the pathway sprinters rely on, running very short distances very quickly. The stash inside a muscle cell is small, so even under ideal conditions it supplies about ten seconds of all-out contraction.
Across the aerobic descriptors, the fatty acid version is more intensive than the glucose version at every point. Fatty acids require more oxygen, take more time because there are many more steps, are more efficient, and last longer. Glucose-driven production can be sustained for hours. Fatty acids can go on essentially indefinitely, as long as there is still fat tissue in the body.
Three ways to compare them
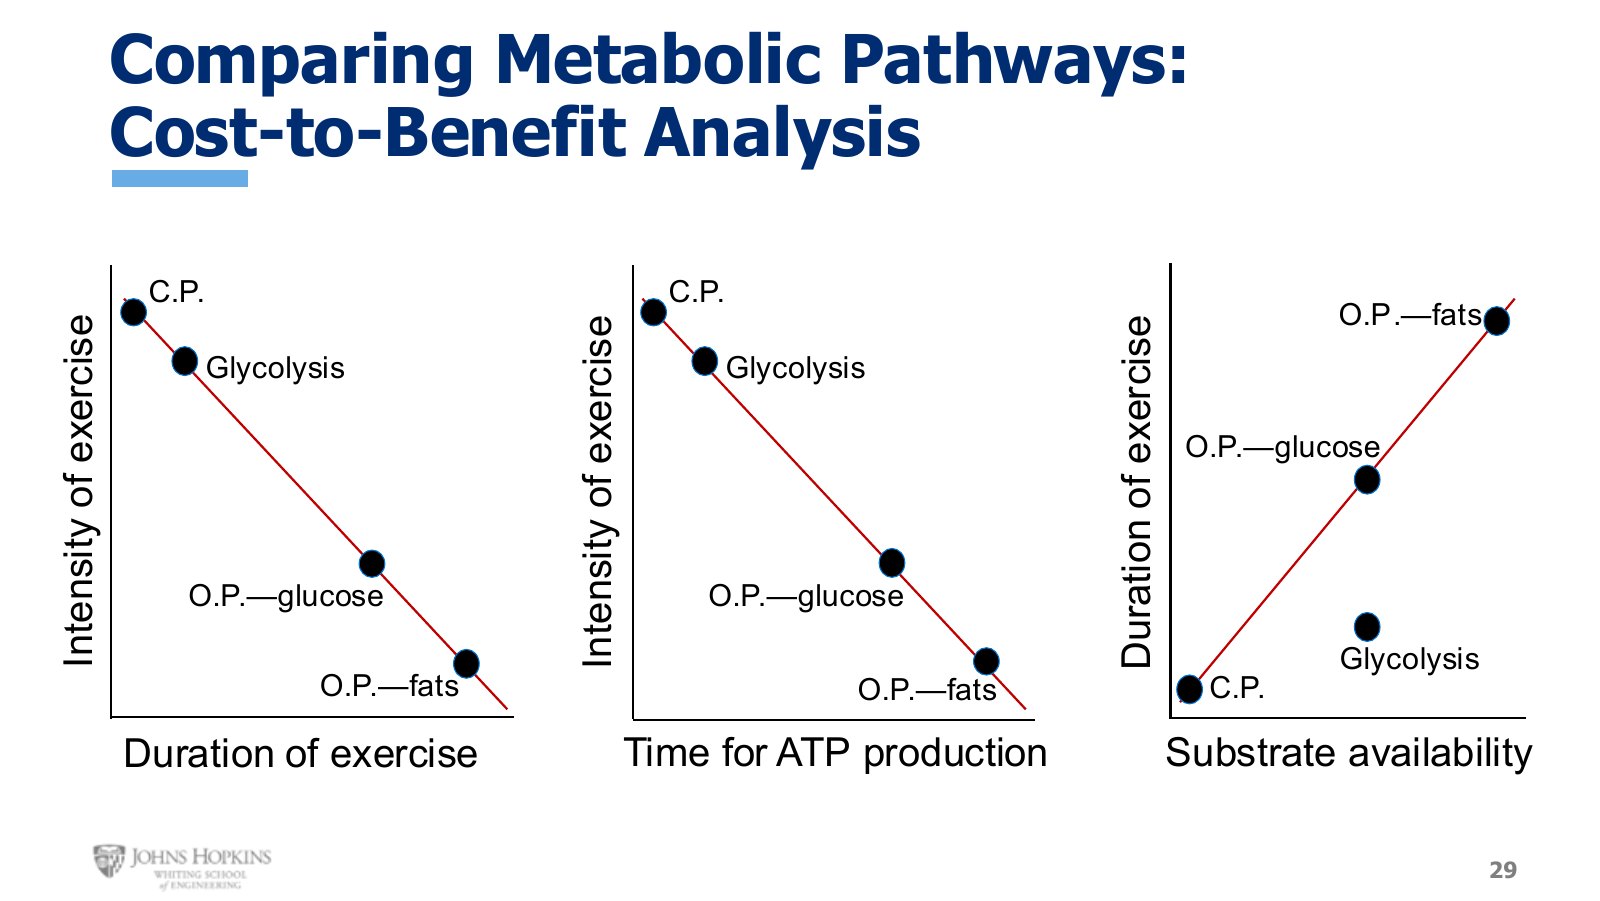
Slide 29. Intensity against duration, intensity against time to produce ATP, and duration against substrate availability.
Intensity versus duration is inverse. Creatine phosphate fuels the most intense exercise for the shortest time. Glycolysis lasts longer at slightly lower intensity. Oxidative phosphorylation of glucose lasts a long time but requires pulling back on intensity a lot. Fats allow essentially indefinite exercise at very low intensity.
Intensity versus time to produce ATP is also inverse, and for the same reason. Creatine phosphate produces ATP almost instantly, so it supports very intense work. Each successive pathway takes longer to deliver its ATP, so intensity has to come down.
Duration versus substrate availability is direct, with one exception. We store very little creatine phosphate. We have a good deal of glucose, in blood and as glycogen. The body is incredibly good at storing fat, so that pathway runs nearly forever. Glycolysis is the outlier and does not follow the trend line, because its limit comes from byproduct accumulation rather than substrate.
Fiber types
Skeletal muscle cells vary in myosin ATPase activity, twitch speed, force production, fiber diameter, aerobic capacity, color under the microscope, anaerobic capacity, favored metabolic pathway, fatigue resistance, and how they get used. Those differences follow clear patterns, so the cells sort into categories.
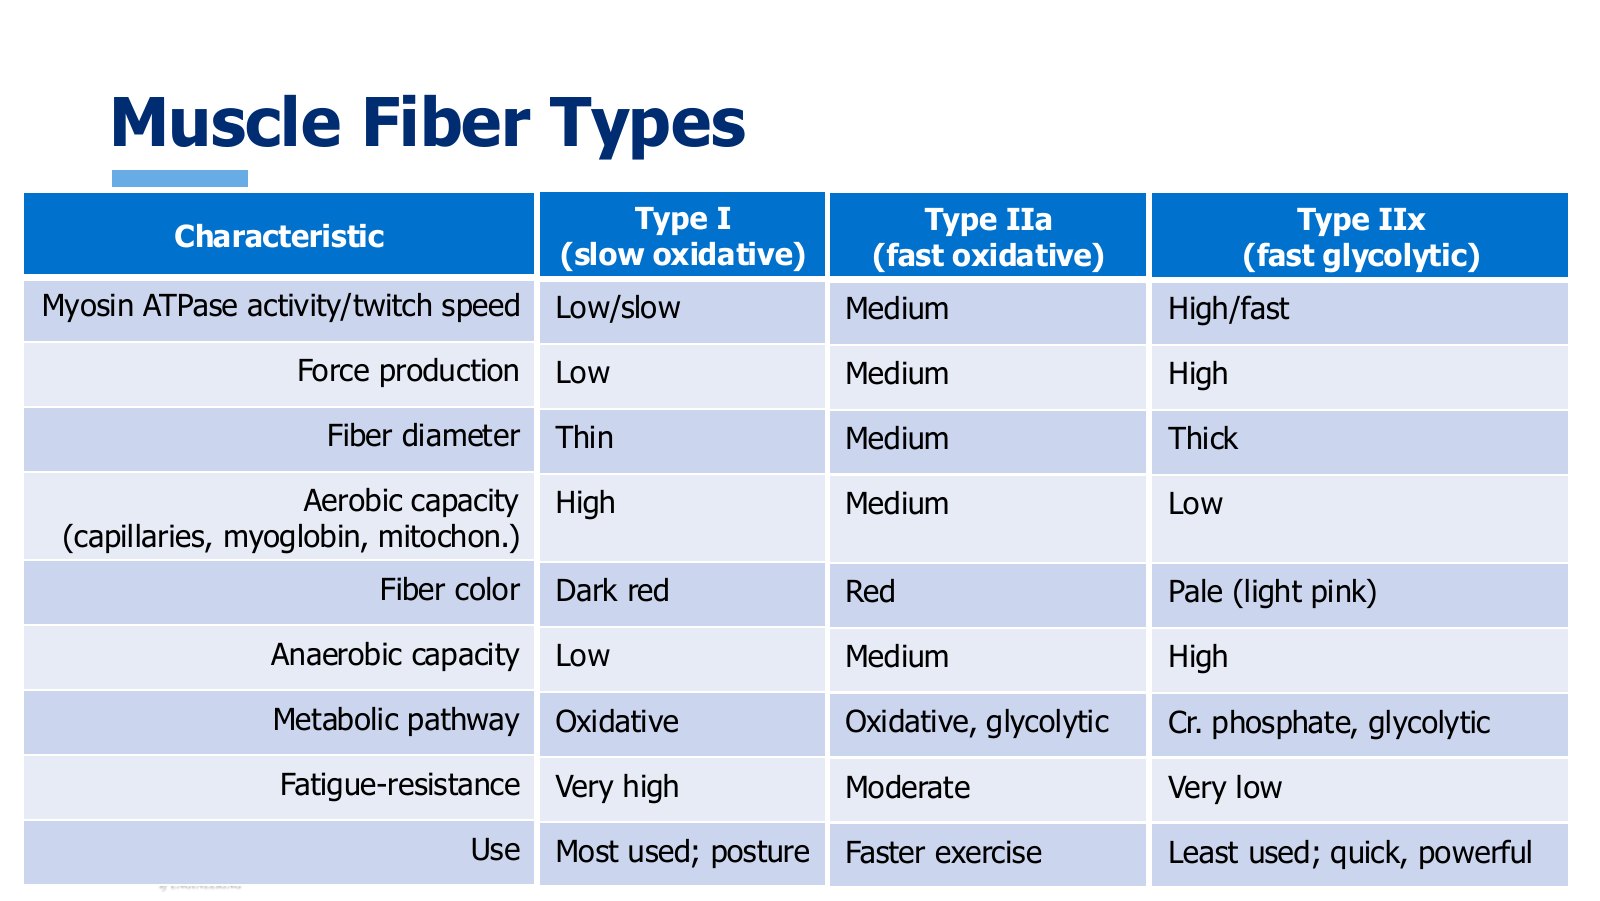
Slide 30. The full comparison table. Reading down a column gives you a coherent cell.
Type I, slow oxidative. Low myosin ATPase activity, so myosin hydrolyzes ATP more slowly and a single twitch proceeds more slowly and drawn out. Force production is low because the cells are fairly thin, with less actin and myosin. Aerobically well equipped, with lots of capillaries, lots of myoglobin, and lots of mitochondria, which also gives a deep red color. Poorly equipped for anaerobic pathways, so they rely heavily on oxidative phosphorylation, which makes them very fatigue resistant. Perfect for tasks lasting hours, like the postural muscles that help us sit and stand and walk.
Type IIx, fast glycolytic. The polar opposite. Very high myosin ATPase activity, very fast cross-bridge turnover, very fast force generation. Force production is very high because the diameter is thick, with lots of actin and myosin. Aerobic capacity is low, with few capillaries, low myoglobin, and few mitochondria, so they appear pale. High levels of the cytoplasmic enzymes for anaerobic pathways, so they play to that strength and fatigue very quickly. Used for very quick or very powerful movements, and used least often.
Type IIa, fast oxidative. The intermediate. Myosin ATPase activity, twitch speed, force production, fiber diameter, and both aerobic and anaerobic capacities are all medium, and the color sits in the middle at medium red. They use both oxidative and glycolytic pathways to a moderate extent, with moderate fatigue resistance, so they cover more intense activities that do not require Type IIx intensity: faster walking, jogging, swimming, cycling.
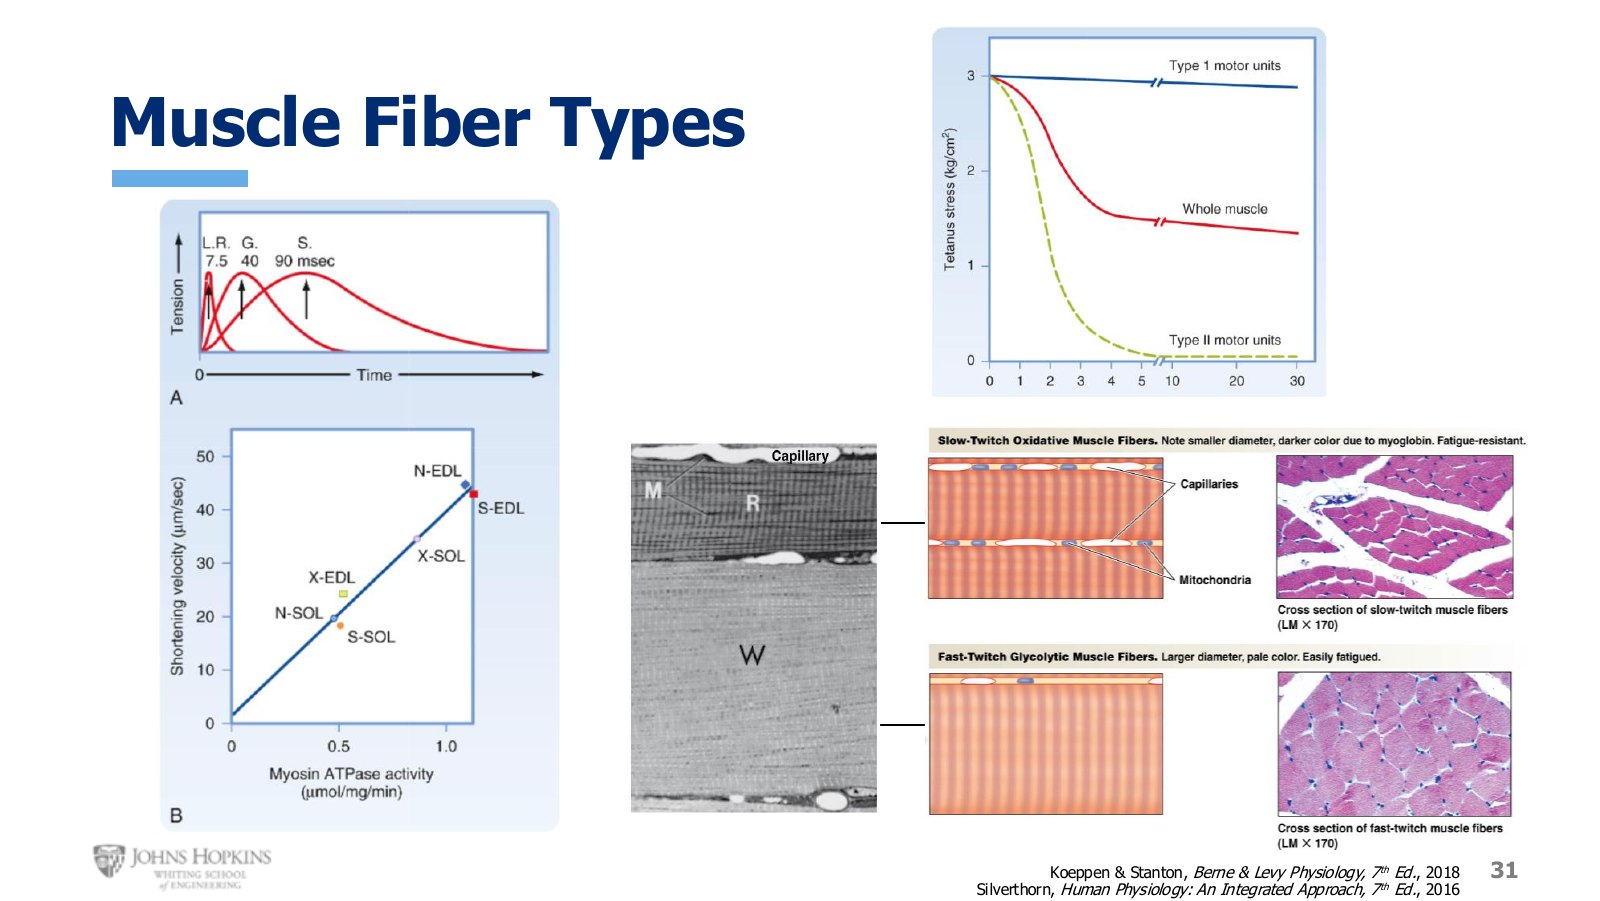
Slide 31. Twitch speed by muscle, fatigue curves over 30 minutes, and the fibers under the microscope.
Twitch durations differ dramatically by muscle: a Type IIx fiber from the lateral rectus in the eye controlling lightning fast eye movements, a Type IIa fiber in the gastrocnemius, the prominent calf muscle used for running and jumping, and a Type I fiber in the soleus, a different calf muscle used more for the endurance work of standing and walking. Increasing myosin ATPase activity correlates strongly with faster sarcomere shortening velocities and thus faster rates of contraction.
The fatigue curves make the point sharply. Type II fibers have no force production left after five minutes. Type I fibers are still going strong after thirty.