8D · Vascular Pressures (P)
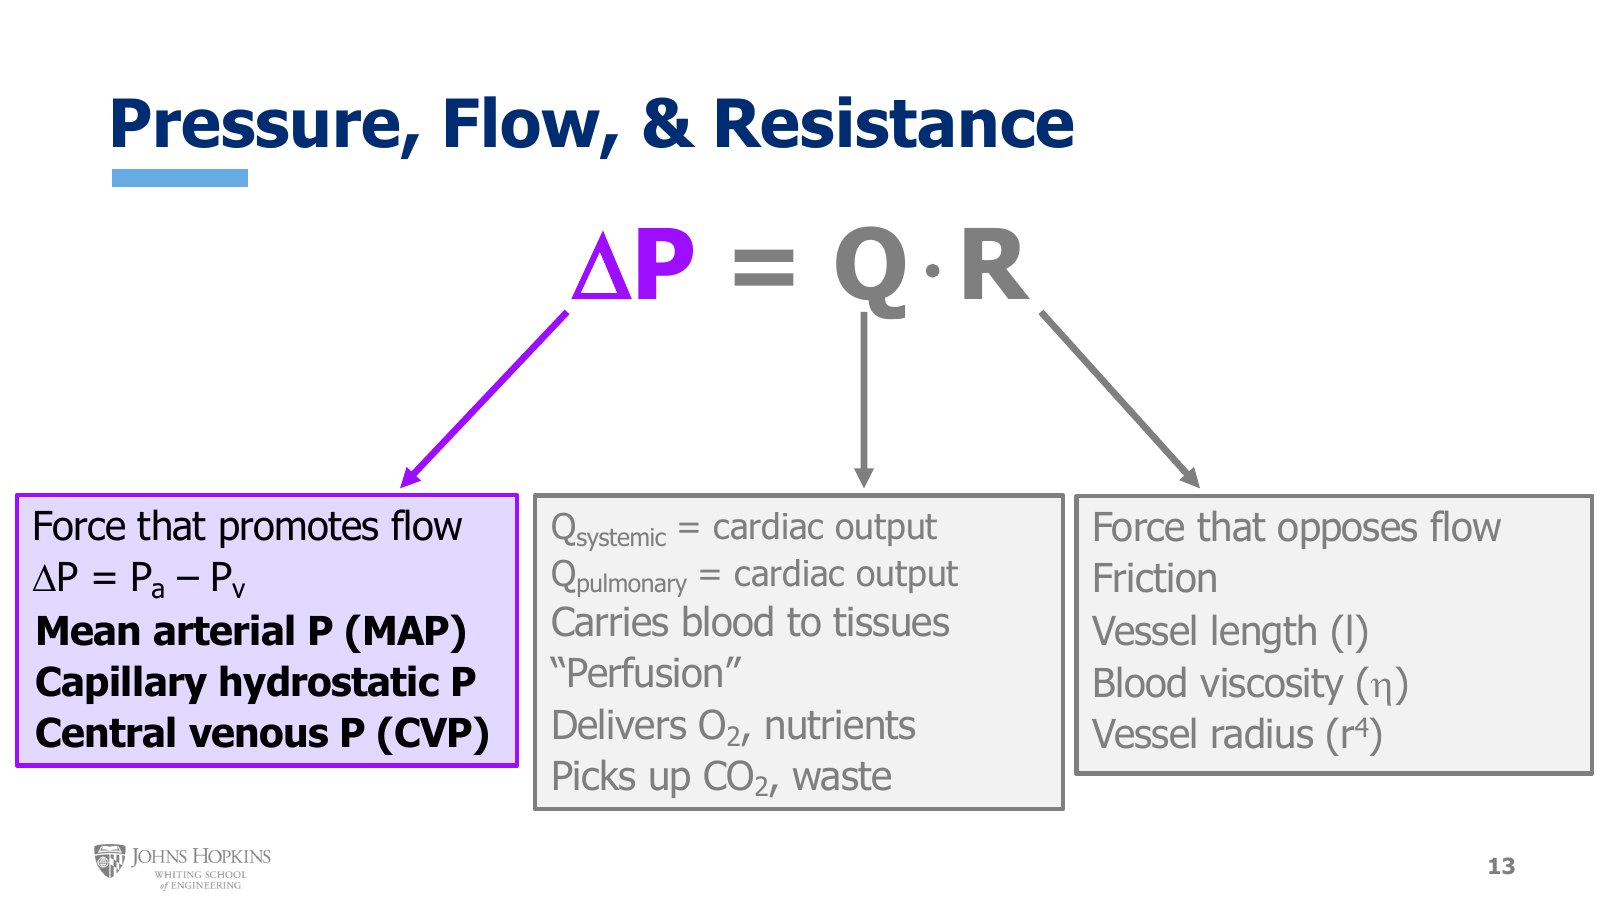
Slide 13. The overview again, with ΔP highlighted: the force that promotes flow, and the three systemic pressures this lecture covers.
Lecture 8B laid out the three major variables in the fluid dynamics version of Ohm’s law. This lecture takes a deeper look at the different pressures: how we define them, their significance, and what to keep in mind as we study them.
Pressure across the whole circulation
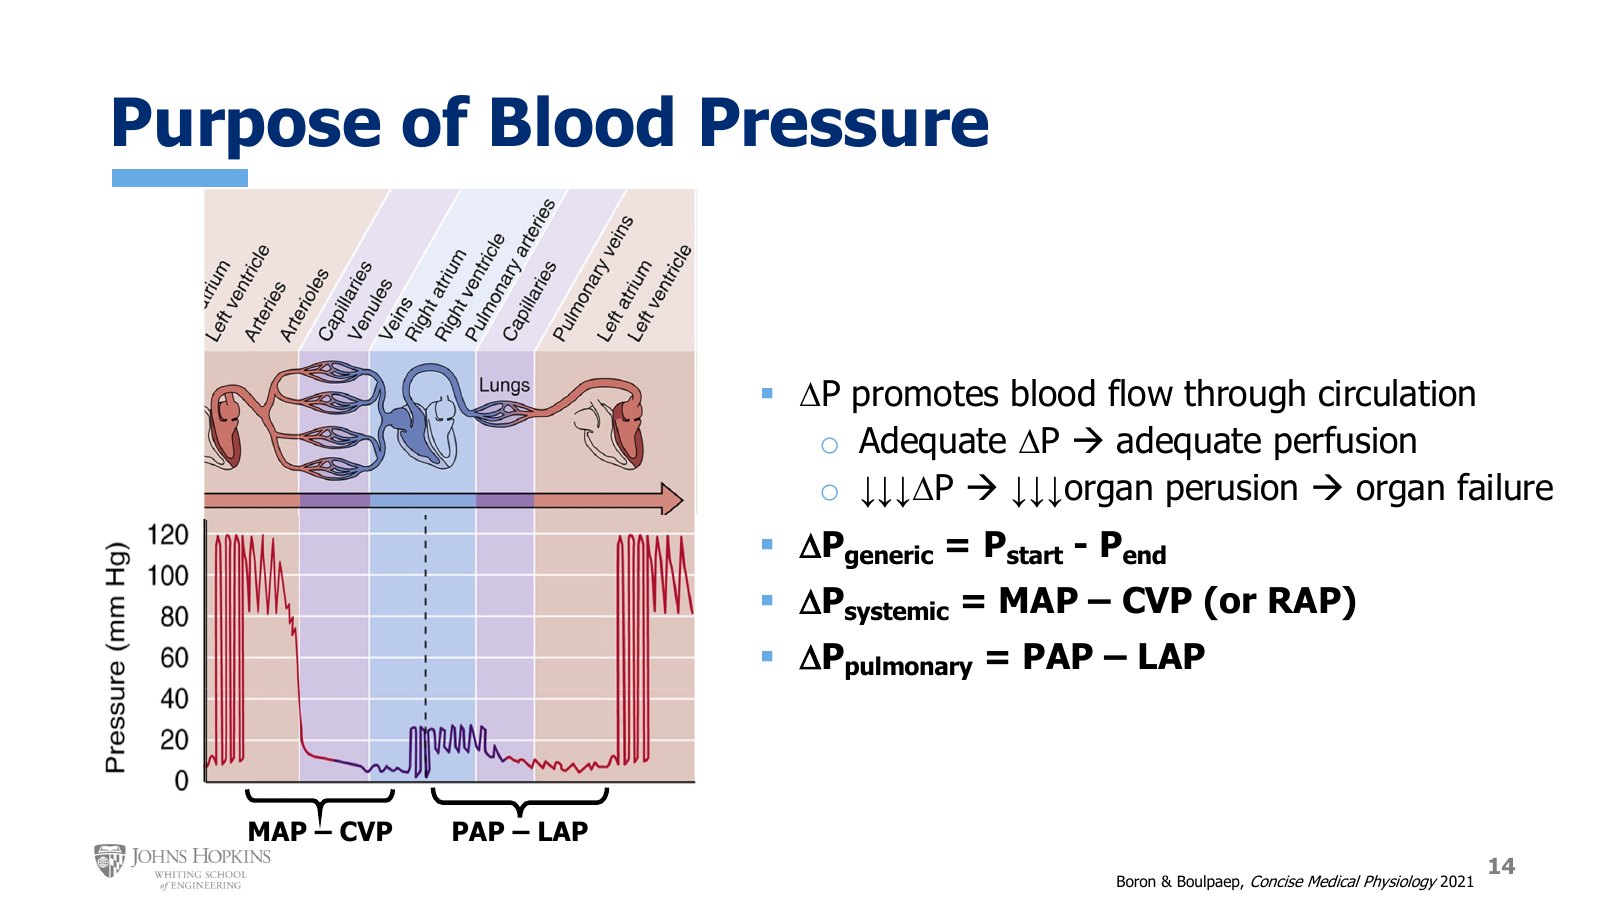
Slide 14. Pressure through the systemic and then the pulmonary circulation, from left ventricle back to left ventricle. Brackets mark the systemic gradient, MAP − CVP, and the pulmonary gradient, PAP − LAP.
The figure is a big-picture view of pressure through the entire circulation. Across the top is a sequential map of the cardiovascular structures. The systemic circulation runs from the left ventricle into the systemic arteries, then arterioles, capillaries, venules, veins, and finally the right atrium. The pulmonary circulation runs from the right ventricle into the pulmonary arteries, pulmonary capillaries, pulmonary veins, and back into the heart at the left atrium. Across the bottom are the pressure waveforms for each region, with values on the y-axis and whether the pressure is pulsatile or not.
Left ventricle. Very pulsatile, alternating between very high during systolic contraction and very low during diastolic filling.
Arteries. Pressure remains high and somewhat pulsatile, though not as pulsatile as the left ventricle itself. The lowest values are now around 80 mmHg instead of zero.
Beyond the large arteries. Pressure becomes less pulsatile and decreases significantly, so it is fairly low by the systemic capillaries, usually around 30 mmHg. It keeps decreasing, more gradually now, through the capillaries, venules, and veins and back into the right atrium.
Right ventricle. Pulsatility and pressure pick up again as the ventricle contracts, producing about 25 mmHg during systole, then relaxing back to almost 0 mmHg during diastole.
Pulmonary vessels. The same pattern as the systemic circulation on a smaller scale. Pressures are highest nearest the ventricle and still pulsatile, then fall and become less pulsatile farther from the ventricle, through the capillaries and veins and back into the left atrium.
The purpose of blood pressure
Vascular pressures are what promote blood flow through the circulation. When arterial pressures are sufficiently high, ΔP is also sufficiently high, and organ perfusion is adequate to meet our needs. When arterial pressures are too low, ΔP is also too low, perfusion of vital organs is too low, and the result is organ failure and often death.
The pressure gradient driving flow from the arterial side to the venous side is most generically the pressure at the beginning of the circulatory path minus the pressure at the end.
More specifically, the gradient driving blood through the systemic circulation is typically mean arterial pressure, the average pressure in the arteries, minus central venous pressure, the pressure in the vena cava at the very end of the venous side, just as it joins the right atrium. Because central venous pressure (CVP) is measured so close to the right atrium, CVP and right atrial pressure (RAP) are virtually identical, and either can serve as the pressure at the end of the circuit. The pulmonary gradient is comparable: pulmonary artery pressure minus left atrial pressure.
From here on, the study of vascular pressures is limited to the systemic circulation. The pulmonary circulation comes back in more detail with the respiratory system and pulmonary function later in the semester.
Arterial pressure
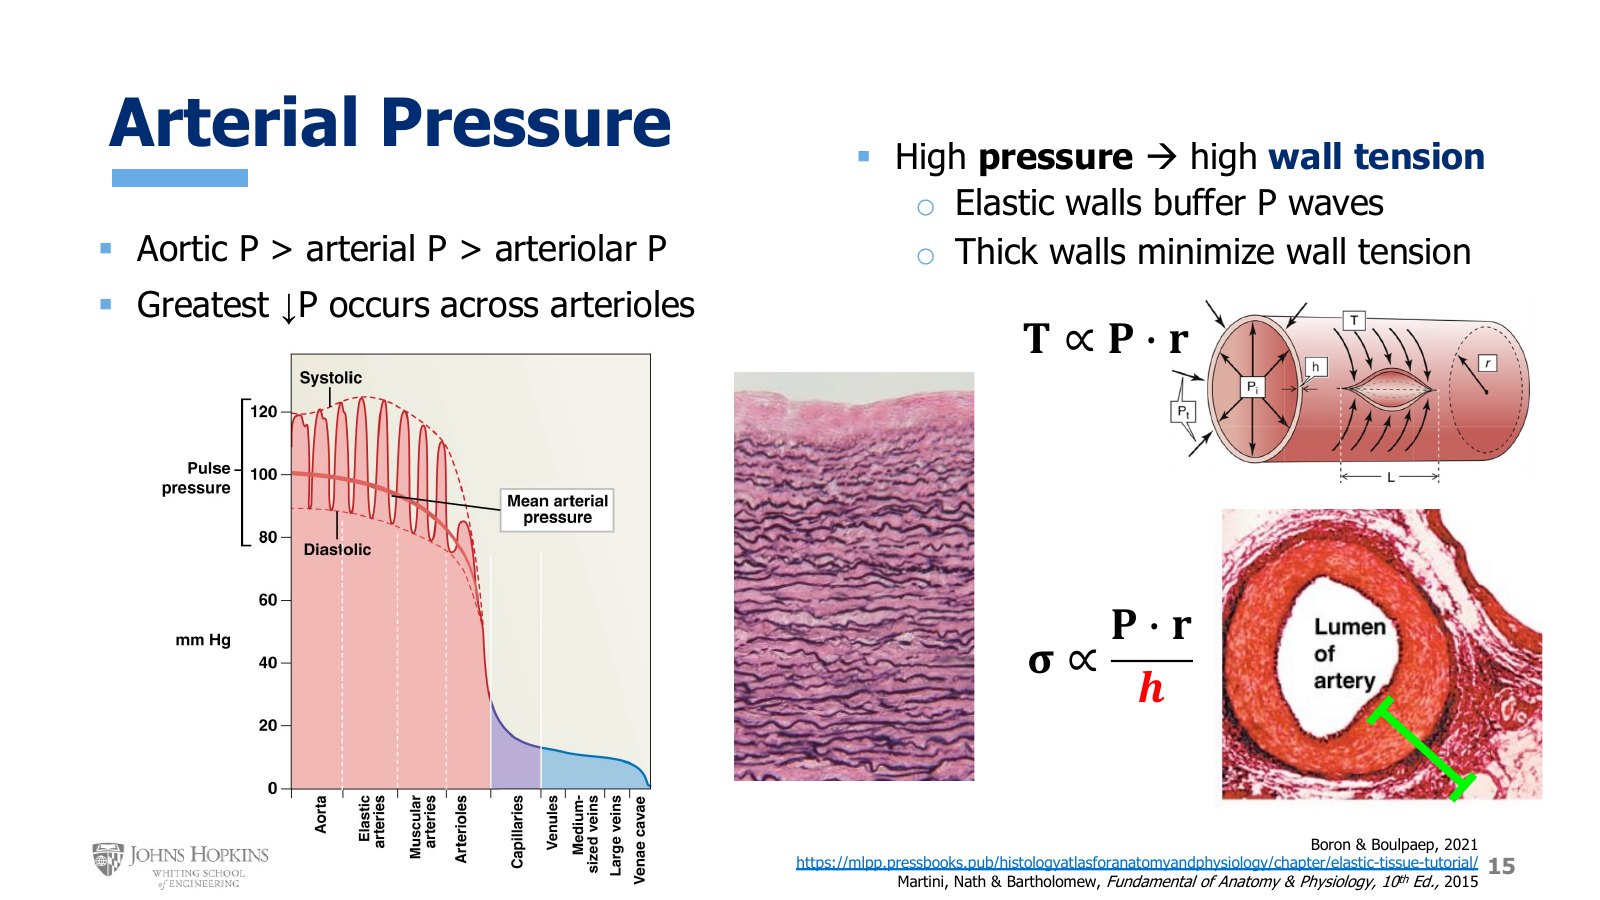
Slide 15. Left, systolic, diastolic, and mean arterial pressure from aorta to venae cavae, with the steepest drop across the arterioles. Center, elastic fibers woven through the aortic wall. Right, wall tension T in a cylinder, and wall thickness h in an artery.
Over the systemic circulation, the aorta and the large and medium-sized arteries show pulsatile systolic and diastolic pressures, with mean arterial pressure superimposed over the waveform. Pressure decreases gradually from the aorta into the arteries. Moving from arteries into arterioles brings two big changes:
Pressure loses its pulsatility in the arterioles.
The steepest, most dramatic pressure drop of any point in the circulation happens here.
Mean pressure starts in the neighborhood of 100 mmHg in the aorta, declines to around 80 mmHg entering the arterioles, and is about 30 mmHg by the end of the arterioles, ready to enter the capillaries.
Wall tension
Wall tension is the force it takes to keep the vessel from rupturing, illustrated by the arrows pointing toward a tear in the vessel, trying to hold it together. Arteries have an internal drive to regulate their wall tension around a set point. They don’t like wall tension to be too high, precisely because high wall tension is associated with a higher risk of rupture.
From the Law of Laplace, probably familiar from previous coursework or professional experience, wall tension is proportional to the pressure inside the vessel times the radius of the vessel.
A more pressurized vessel requires higher wall tension to keep it from rupturing, and so does a larger vessel. Arteries experience the highest pressures in the circulation, and the aorta has a huge internal radius. Together, that means the largest arteries are at risk of extraordinarily high wall tension. Arteries do two things to bring wall tension down a bit, back from the brink of rupture.
First, elastic tissue. The aorta, the largest and most pressurized vessel in the body, contains a lot of elastic protein fibers. In this microscope image of a section of aortic wall, the dark wavy elastic fibers are interwoven all through the wall, not simply confined to the internal and external elastic membranes. The high elastic content helps buffer some of the huge pressure waves coming from the left ventricle. The elasticity of the aorta decreases the pressure its walls experience by absorbing some of that pressure. The higher the tension a vessel wall will experience, the higher its elastic content, as a mitigation measure of sorts.
Second, thick walls. Arteries have thick walls, and thicker walls decrease wall tension and thus the tendency to rupture. The Law of Laplace applied to cylinders like blood vessels assumes the cylinder has very thin walls, but most blood vessels don’t meet the criteria for thin-walled cylinders. For thicker-walled cylinders we use an equation for wall stress, which is simply wall tension divided by wall thickness, h.
Because wall thickness is in the denominator, the thicker the wall, the more it lowers the wall stress for the vessel, and the lower the tendency to rupture.
Systolic, diastolic, mean, and pulse pressure
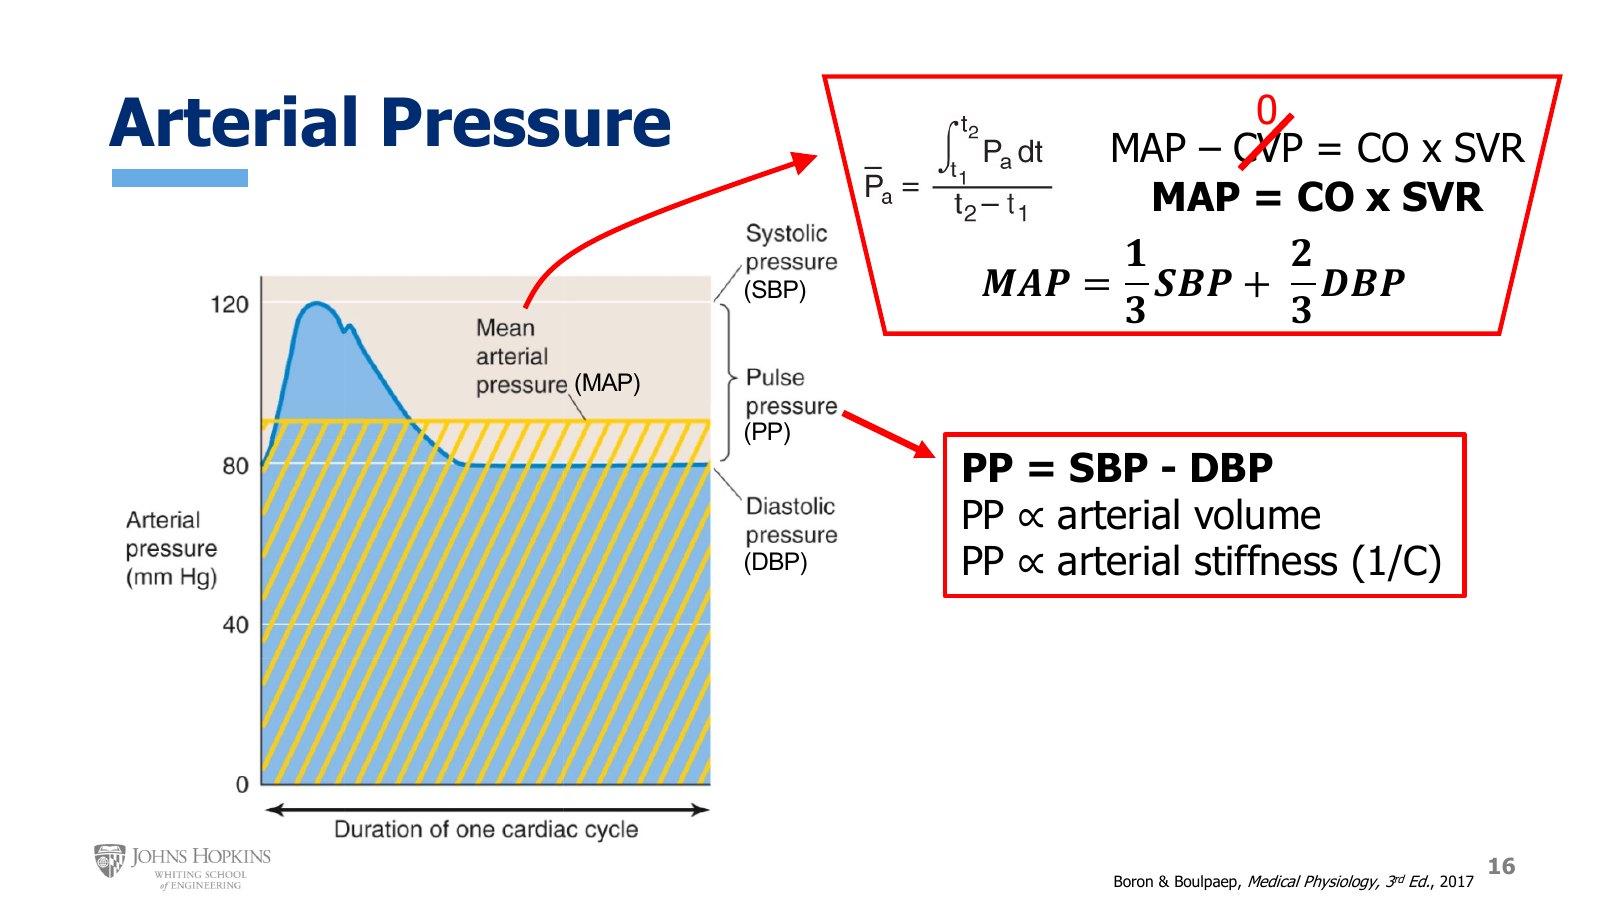
Slide 16. One aortic pressure waveform. SBP at the top, DBP at the bottom, MAP as the yellow hatched level, and pulse pressure between SBP and DBP. Boxed, the integral definition of MAP and the MAP and PP equations.
A typical aortic pressure waveform over a single cardiac cycle rises as the heart ejects blood into the aorta during systole, then falls as the heart stops ejecting during diastole. The highest pressure the arteries experience is systolic blood pressure, SBP. The lowest is diastolic blood pressure, DBP. In a clinical setting, the two numbers given for a blood pressure reading are always systolic over diastolic, so you might hear 120 over 80, or 110 over 72.
Mean arterial pressure. Even though we use the term mean, it is a bit misleading. It is not the true mathematical mean of systolic and diastolic pressures. Mean arterial pressure is really the integrated area under the pressure curve of a single cardiac cycle, the yellow shaded area. It tries to express the overall average pressure an artery experiences over one cardiac cycle. Since systole is fairly short and diastole fairly long, you can’t just average the two together.
The most accurate way to arrive at MAP is to calculate the integral for the area under the curve, but nobody in clinical medicine does this in their heads. Instead:
We can say this because, at least under resting conditions, we spend about a third of our time experiencing systolic pressures and about two thirds experiencing diastolic pressures. It is a handy, if somewhat approximated, way to calculate MAP on the fly. It also means MAP will always be weighted more heavily toward diastolic pressure.
MAP from Ohm’s law. Working MAP into the systemic version of Ohm’s law, the systemic pressure gradient, MAP minus CVP, equals cardiac output times systemic vascular resistance.
Central venous pressure is so low, maybe 2 or 3 mmHg, that we usually just round it down to 0. That simplifies the expression:
You should be equally conversant with both methods of calculating mean arterial pressure.
Pulse pressure. The difference between systolic and diastolic pressures is the pulse pressure.
If pulse pressure is too small or too large, it can give insight about what might be going wrong in the circulation. Those insights boil down to two relationships:
Pulse pressure is directly proportional to the volume of blood contained in the arteries, and directly proportional to arterial stiffness. As we know from ventricular stiffness, stiffness is simply the reciprocal of compliance, which leads to arterial compliance.
Arterial compliance
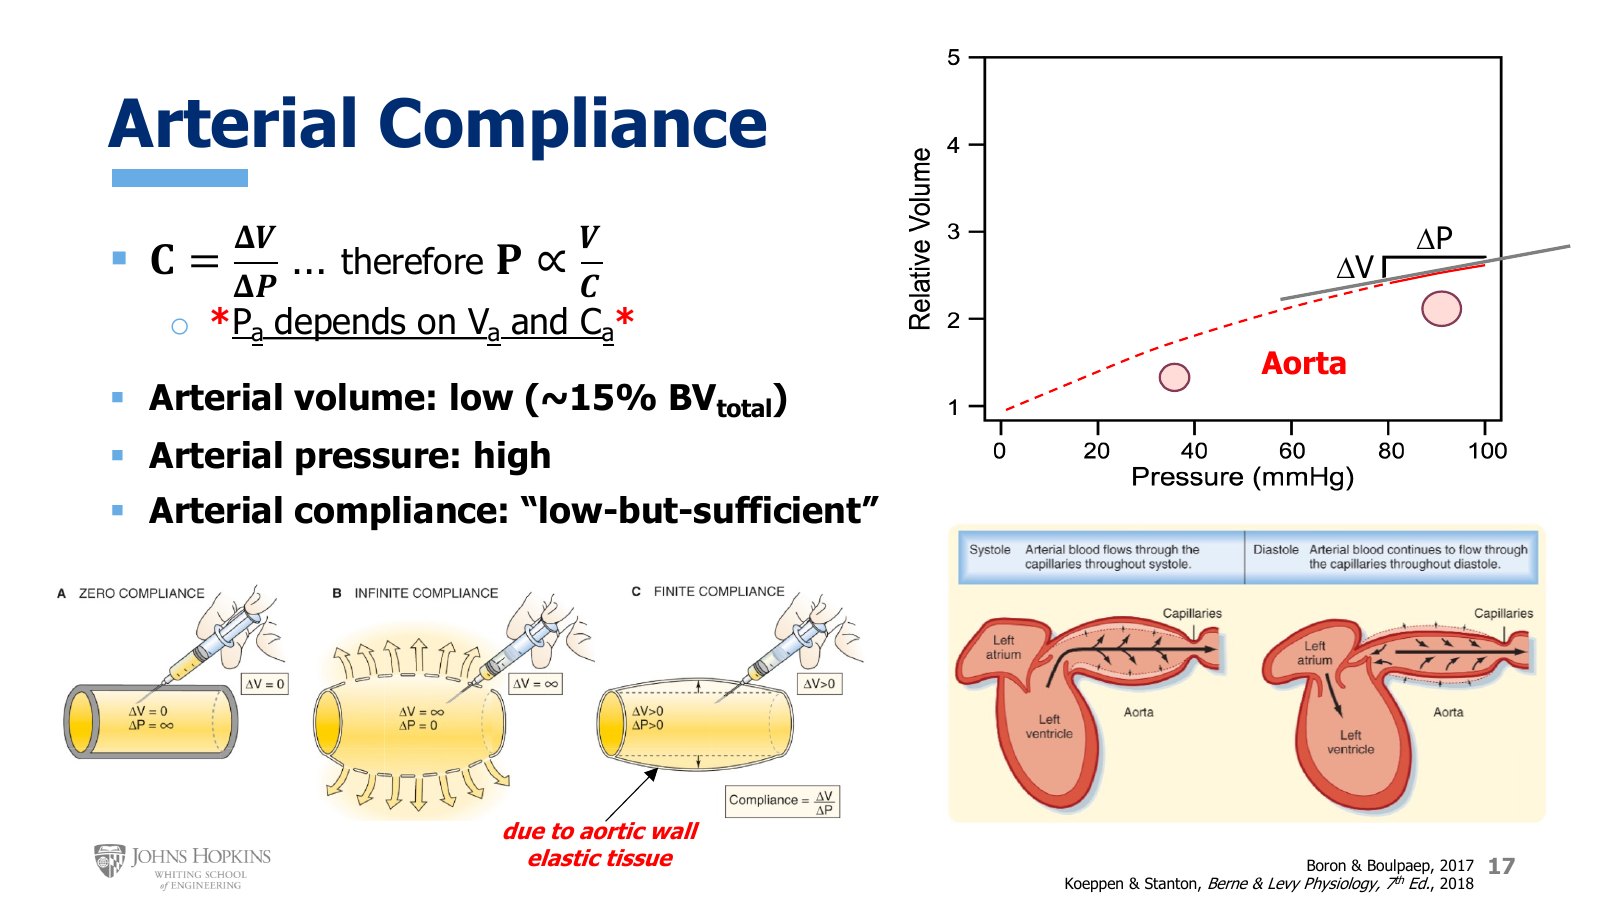
Slide 17. Top right, the aortic volume-pressure curve, solid only over the physiological 80 to 100 mmHg. Bottom left, zero, infinite, and finite compliance. Bottom right, the aorta stretching during systole and recoiling during diastole.
Compliance is the change in volume experienced in an enclosed space divided by the change in pressure experienced within that same space over the same period of time. Rearranging it a little, pressure is proportional to the volume contained in the vessel divided by the compliance of the vessel.
So arterial pressure, Pa, depends on the volume contained in the arterial side of the circulation, Va, and the compliance of the arterial circulation, Ca.
Arterial volume is low. As a percent of total blood volume in the whole cardiovascular system, arterial volume is surprisingly low, only about 15%. Humans have about 70 mL of blood per kilogram of body weight.
Arterial pressure is high. This is the high-pressure side of the circulation, after all. That means arterial compliance is fairly low, but still sufficient for our needs: “low but sufficient.”
Low. On the compliance curve for the aorta, pressure is on the x-axis and volume on the y-axis, so the slope of the graph represents compliance. The curve runs over a wide range of pressures, from 0 to 100 mmHg, but the only physiologically relevant part is the solid part between 80 and 100, the pressures the aorta actually experiences. The slope there is fairly flat, a small change in volume divided by a big change in pressure. Aortic compliance isn’t huge.
But sufficient. Healthy aortas do their jobs remarkably well, which tells us this degree of compliance must also be sufficient. The generalized schematic shows why.
Zero compliance. Even trying, unsuccessfully, to push more volume into the enclosed space produces an enormous pressure increase. That would definitely be bad for aortic function.
Infinite compliance. You could keep adding volume and the pressure would never start to increase. That would also be bad, because we need some aortic pressure to serve as driving pressure for flow through the rest of the system.
Finite compliance. What the aorta has. It can accommodate some increase in volume with some corresponding increase in pressure, because it has distensible walls that expand with the influx of volume from the left ventricle.
This distensibility, the critical ability to expand to accommodate more volume with only a moderate, not infinite, increase in pressure, is enabled by the high elasticity of the aortic wall.
Take aortic elasticity one step further. The walls not only stretch to accommodate ventricular ejection volume during systole, they also recoil inward to push that volume along during diastole. That is why we always have forward flow through the arteries, even when the heart is in diastole and not currently pumping. The elastic aortic wall gives sufficient distensibility, elasticity, and compliance for the aorta to do its job: absorb some of the volume and pressure coming from the ventricle during systole, release it and pass it along during diastole, and develop enough pressure to drive flow through the rest of the systemic circulation.
Capillary pressure
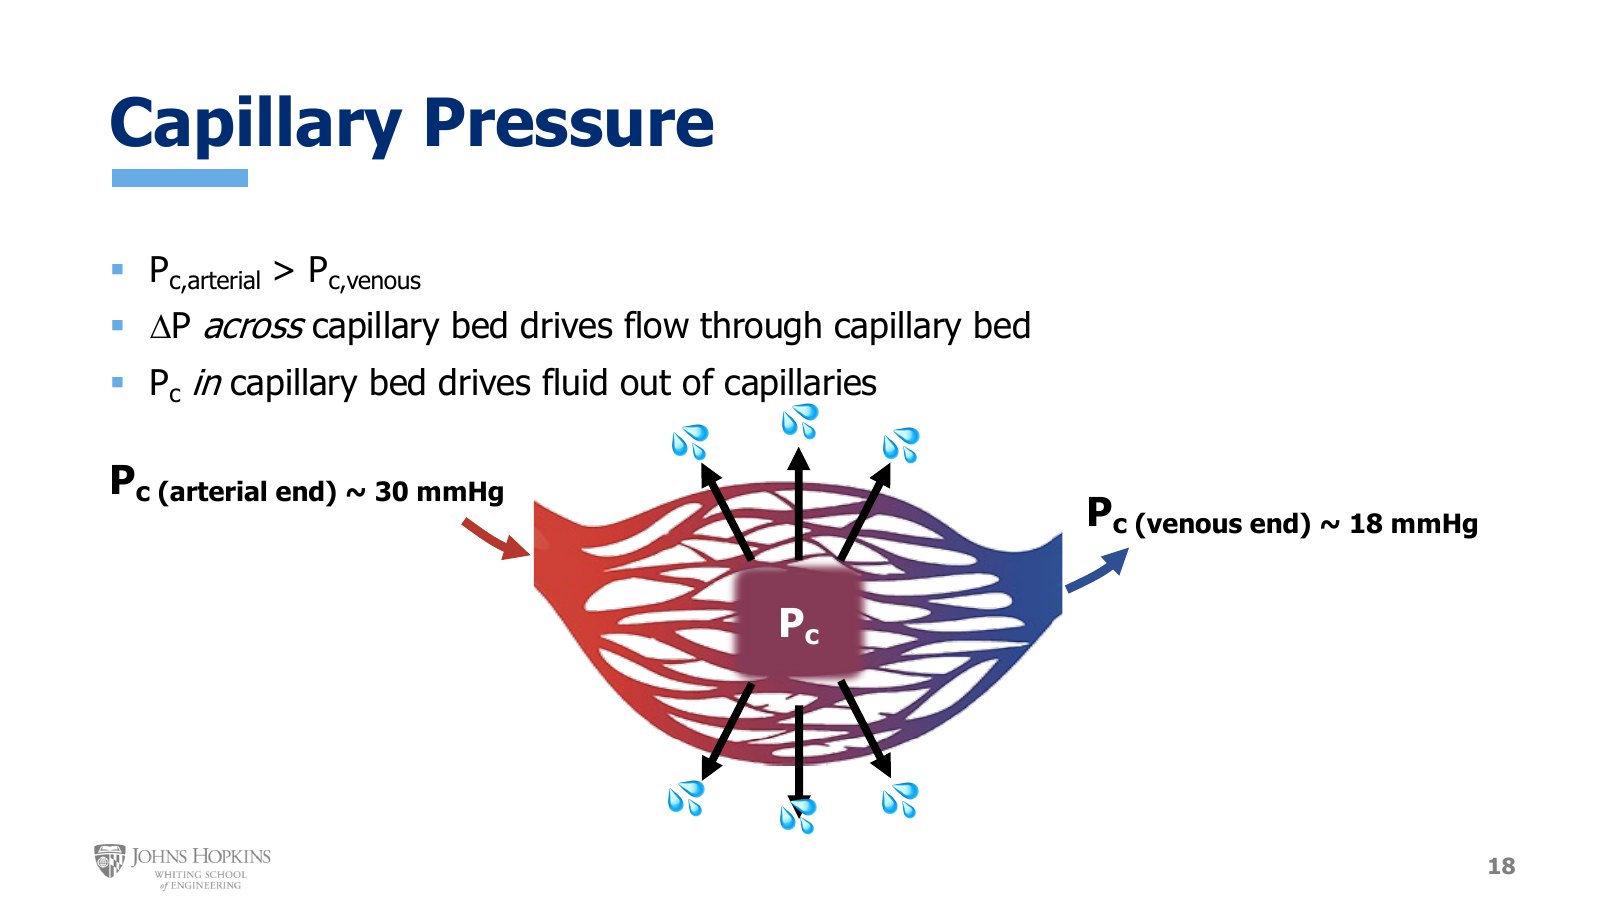
Slide 18. A bare-bones capillary bed. Capillary pressure falls from about 30 mmHg at the arterial end to about 18 mmHg at the venous end, and pushes fluid out of the capillaries throughout the bed.
Moving out of the arteries into the capillaries and veins. Capillary blood pressure is extraordinarily important for describing and explaining how capillaries work, and lecture 8G covers it in detail. For now a quick overview will suffice.
This schematic runs from where the capillary bed branches off the arteriole to where it merges together at the other end to form a venule. Three points:
Just like other segments of the circulation, pressure keeps dropping through the capillaries, so capillary pressure at the arterial end of the bed is greater than at the venous end.
Just like pressure gradients elsewhere, that pressure difference across the capillaries drives flow through the capillaries.
Capillary blood pressure, the pressure inside the capillaries at a given point in the bed, is the force that pushes fluid out of the capillaries and into the surrounding interstitial fluid compartment of the tissues.
Venous pressure
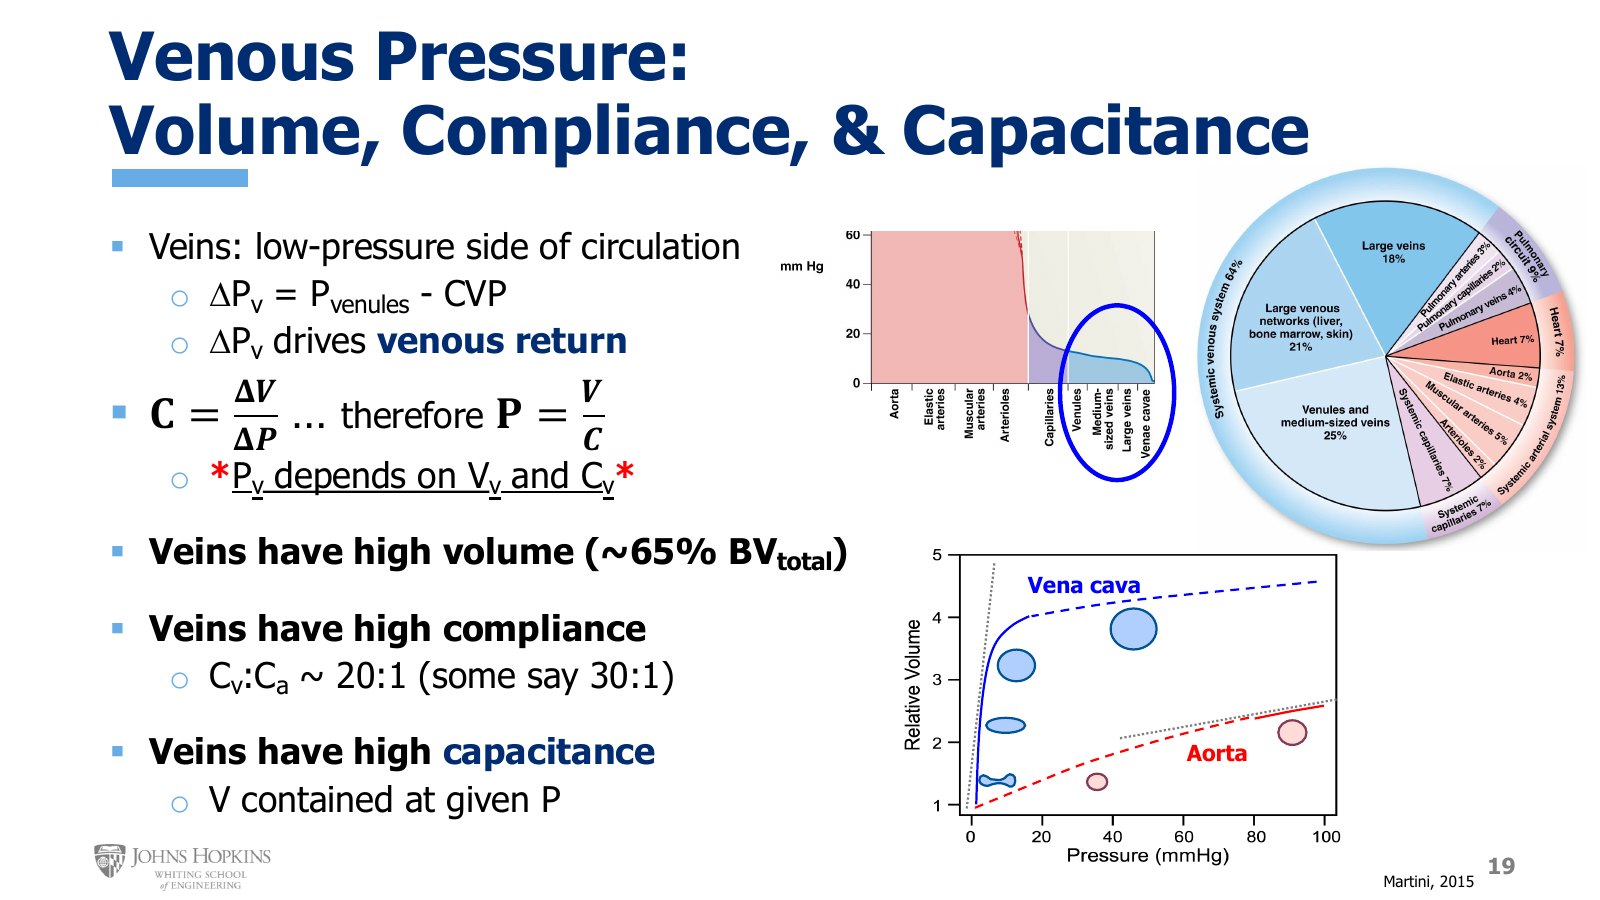
Slide 19. Top, the low venous pressures from venules to venae cavae and the share of blood volume in each part of the circulation. Bottom, the vena cava compliance curve, steep at low pressure, against the aorta’s.
Veins experience the lowest pressures in the circulation, typically from about 18 mmHg in the venules just after the capillaries to only 2 or 3 mmHg by the time the vena cava joins the right atrium. The venous pressure gradient is venule pressure minus central venous pressure, and it pushes blood from the venules back to the heart.
The volume of blood that returns to the heart every minute is called venous return. So the change in pressure over the venous side of the circulation determines flow back to the right atrium.
Just as on the arterial side, because of the relationships between pressure, volume, and compliance, venous pressure, Pv, depends on venous volume, Vv, and venous compliance, Cv.
Venous volume is high. Astonishingly so. The veins of the systemic circulation hold roughly 65% of total blood volume, which comes out to over three liters.
Venous compliance is high. How can the systemic veins hold so much volume at such low pressures? Because they are also incredibly compliant. Adding a venous compliance curve to the aortic tracing for contrast, the venous curve is very different at very low pressures, which is where veins usually operate. In this physiologically relevant part of the curve, the slope, the compliance, is very high, almost a vertical line. Once pressure goes above physiological levels, the curve flattens out almost completely.
Why the abrupt change in direction? Why are veins very compliant and then suddenly not compliant at all? Venous compliance at low pressures is almost entirely attributed to veins being much larger than their arterial counterparts, so it just takes a lot of volume to fill this side of the circulation to capacity. Once the veins are filled to capacity, they don’t have much additional compliance to take on more volume, because they don’t have as much elastic tissue as the arteries. In other words, at low pressures apparent compliance is quite high as the veins fill to their fully rounded state. Any additional volume beyond that point meets venous walls that don’t really like to expand much more.
Along the steep, physiologically relevant portion of the venous curve, the ratio of venous to arterial compliance is somewhere between 20:1 and 30:1. Don’t get hung up on the difference between 20 and 30. Take it as an indication that veins are simply much more compliant than arteries under normal physiological circumstances.
Compliance is not capacitance
At the start of this module, veins were called the capacitance side of the circulation. Many people confuse compliance and capacitance, because the terms sound alike and are related, but they aren’t the same.
Compliance is the relationship between volume and pressure. It is the slope of the curve on this graph.
Capacitance is the volume contained at a given pressure. It is a single data point somewhere along the compliance curve.
Because the systemic veins hold the majority of our blood volume, and hold it at very low pressures, the volume they contain at a given pressure is quite high. Because of their high capacitance, veins act like a blood reservoir, ready to mobilize that volume when necessary, pushing blood into the arterial side of the circulation to help increase arterial pressures.