4E · Cardiac Muscle Function
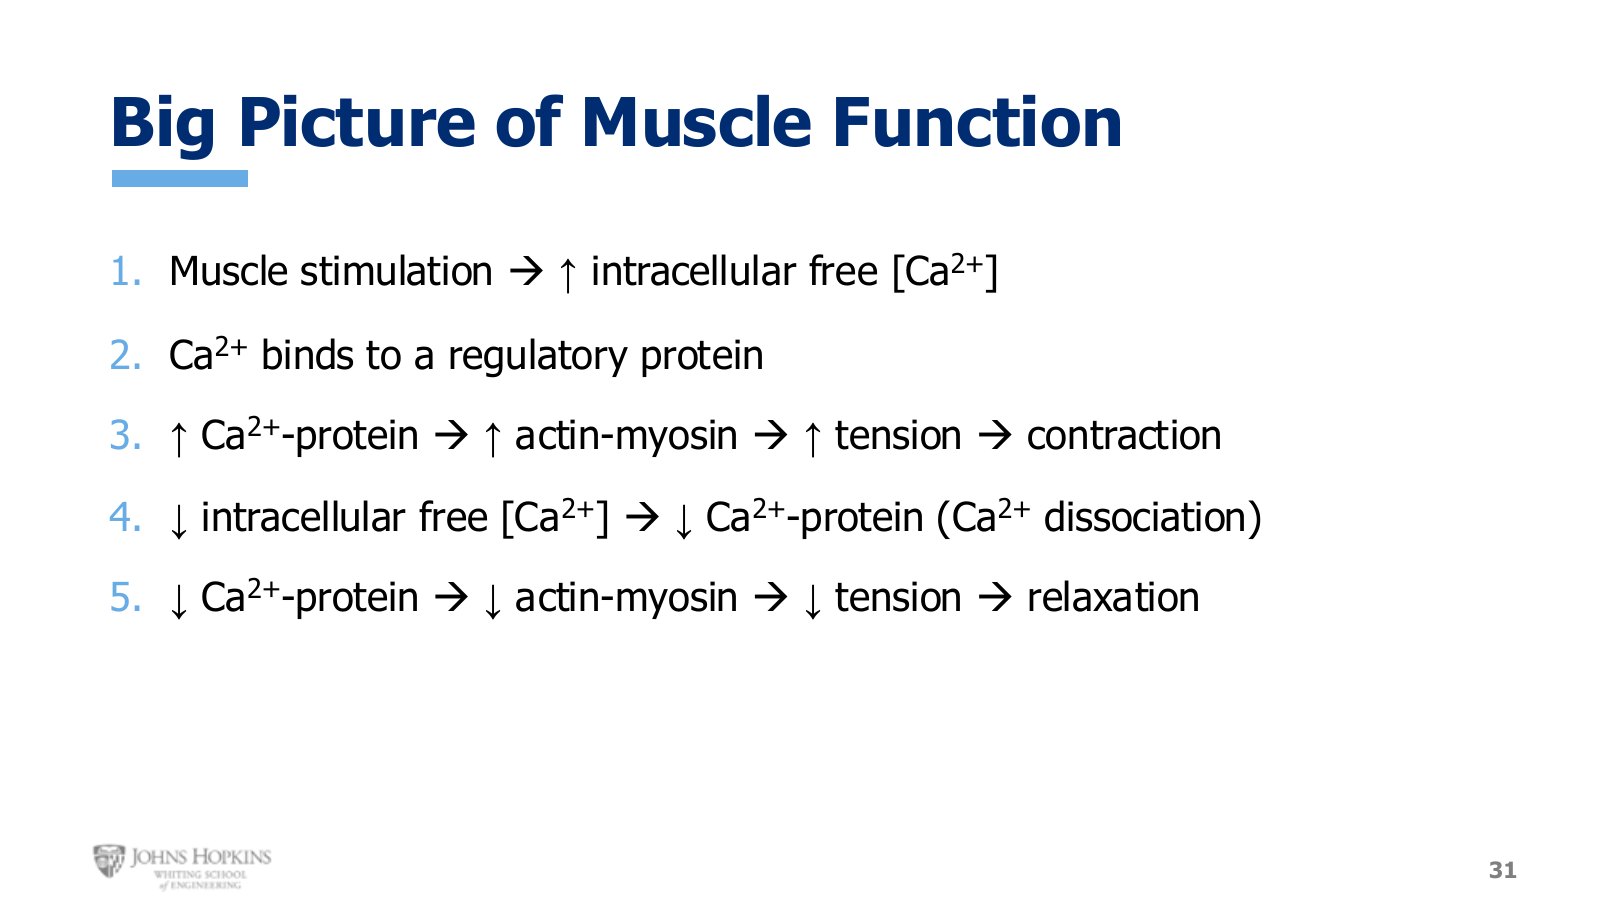
Slide 31. The same five-step template, now applied to cardiac muscle.
The same five-step template from 4B applies: stimulation raises free calcium, calcium binds a regulatory protein, cross-bridging and tension rise, calcium falls, calcium dissociates, tension falls. Cardiac muscle shares some of the specifics with skeletal muscle and others with smooth muscle. Watch for which is which.
The cardiac action potential
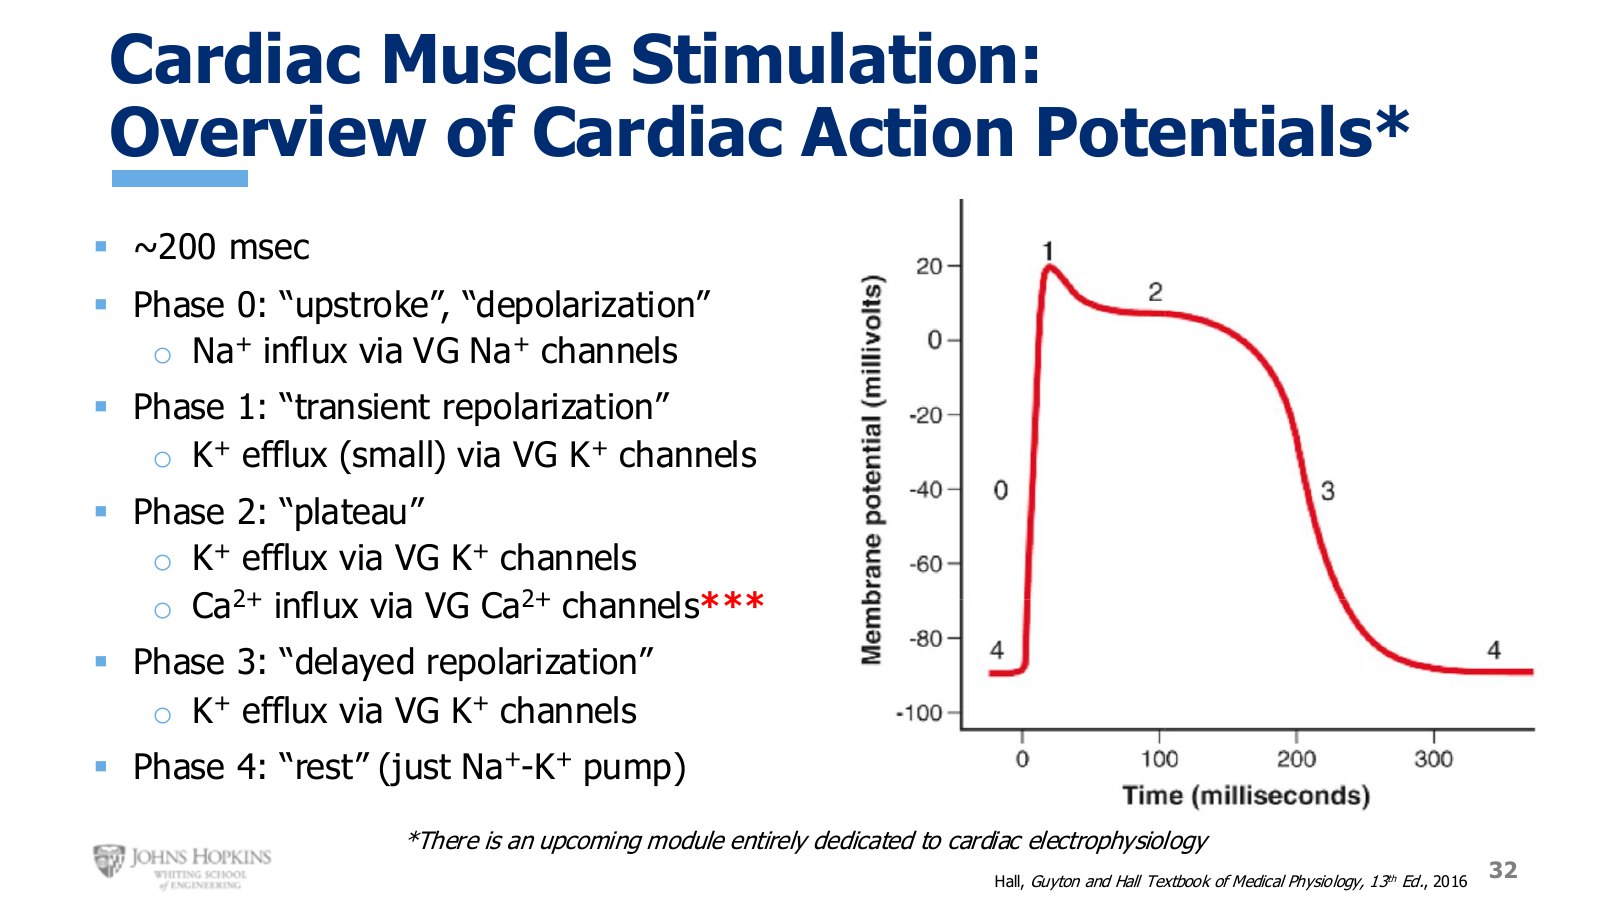
Slide 32. Five numbered phases across roughly 200 ms. The plateau is what makes it unlike anything before it.
The cardiac action potential lasts about 200 milliseconds and has an unusual profile: a sharp depolarizing upstroke, a slight repolarization, a long plateau, a full repolarization, and a resting phase. The phases are labeled numerically.
The five phases
Phase | Name | Ion movement |
|---|---|---|
0 | Upstroke, depolarization | Sodium influx through voltage-gated sodium channels. Takes the cell from −90 mV to about +20 mV. |
1 | Transient repolarization | A few voltage-gated potassium channels open, letting a little potassium out. Brief and subtle. |
2 | Plateau | Significant potassium efflux, offset by calcium influx through voltage-gated calcium channels. Lasts at least 100 ms. |
3 | Delayed repolarization | Calcium channels close, potassium channels stay open, potassium efflux continues. |
4 | Rest | Back around −90 mV. The sodium-potassium pump, running the whole time, is finally noticeable now that everything else has quieted. |
The plateau is the most iconic phase. For membrane potential to hold steady with no net change for a long time, positive charges must flow out at roughly the same rate they flow in, and that is exactly what happens. The calcium influx during phase 2 is what drives contraction, so it matters well beyond the shape of the waveform.
Raising intracellular calcium
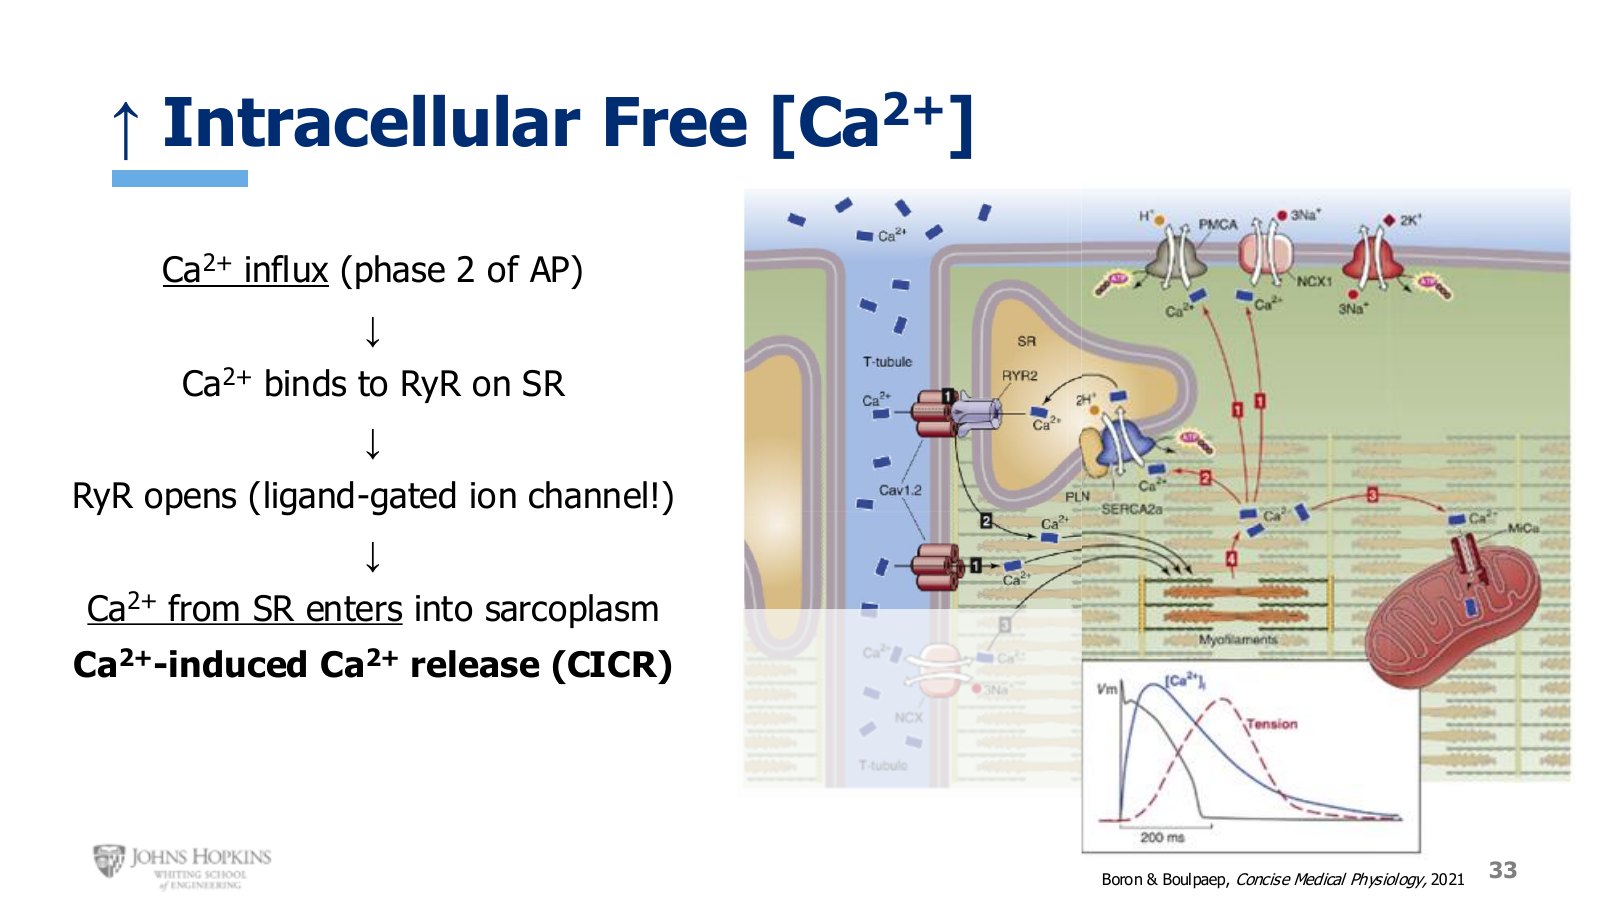
Slide 33. Calcium entering during phase 2 opens the ryanodine receptor. Twenty percent in, eighty percent released.
As the action potential passes along the sarcolemma and down the T tubule, voltage-gated calcium channels open and extracellular calcium flows in. That influx supplies only about 20% of the calcium needed to drive contraction.
Much like smooth muscle, the entering calcium binds ryanodine receptor calcium channels on the sarcoplasmic reticulum, which open and release stored calcium into the cytoplasm, giving the other 80%. Cardiac muscle undergoes the same calcium-induced calcium release seen in smooth muscle.
Calcium binds troponin C
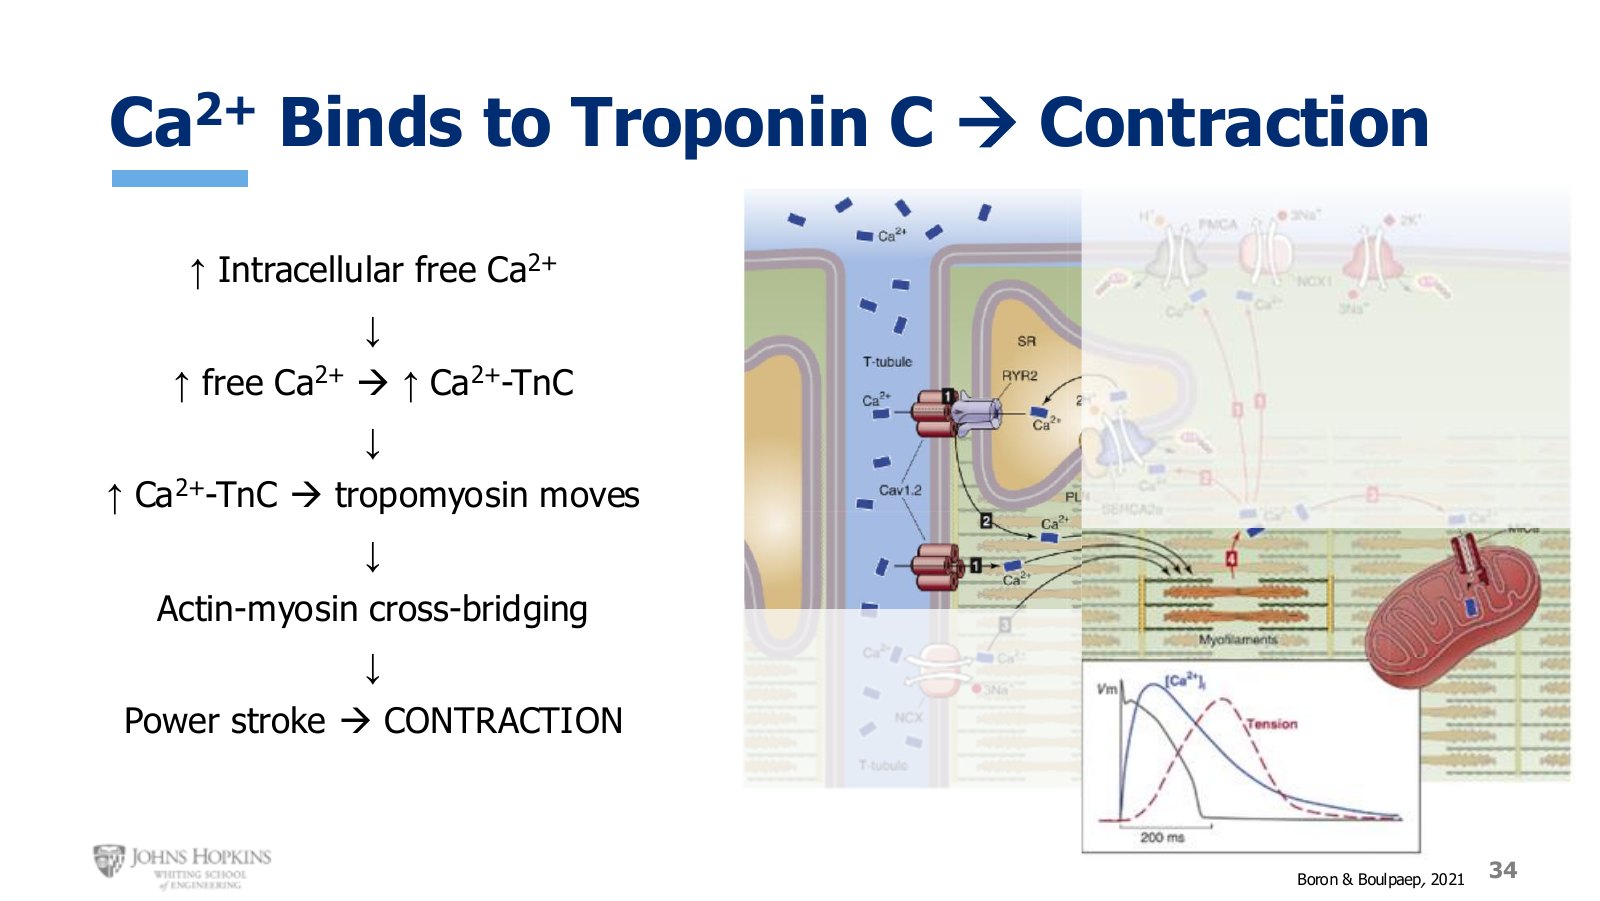
Slide 34. From here the sequence is skeletal muscle’s, with the calcium wave preceding the force wave.
This should feel familiar, because from here it is essentially the skeletal muscle sequence. The rise in free calcium disrupts the resting equilibrium, driving calcium to the sarcomeres to bind troponin C. The troponin complex moves tropomyosin off actin’s binding sites, actin and myosin form cross-bridges and run the sliding filament theory, ending in power strokes and force production.
The inset graph shows the blue calcium wave occurring first, leading the red wave of contractile force.
Lowering intracellular calcium
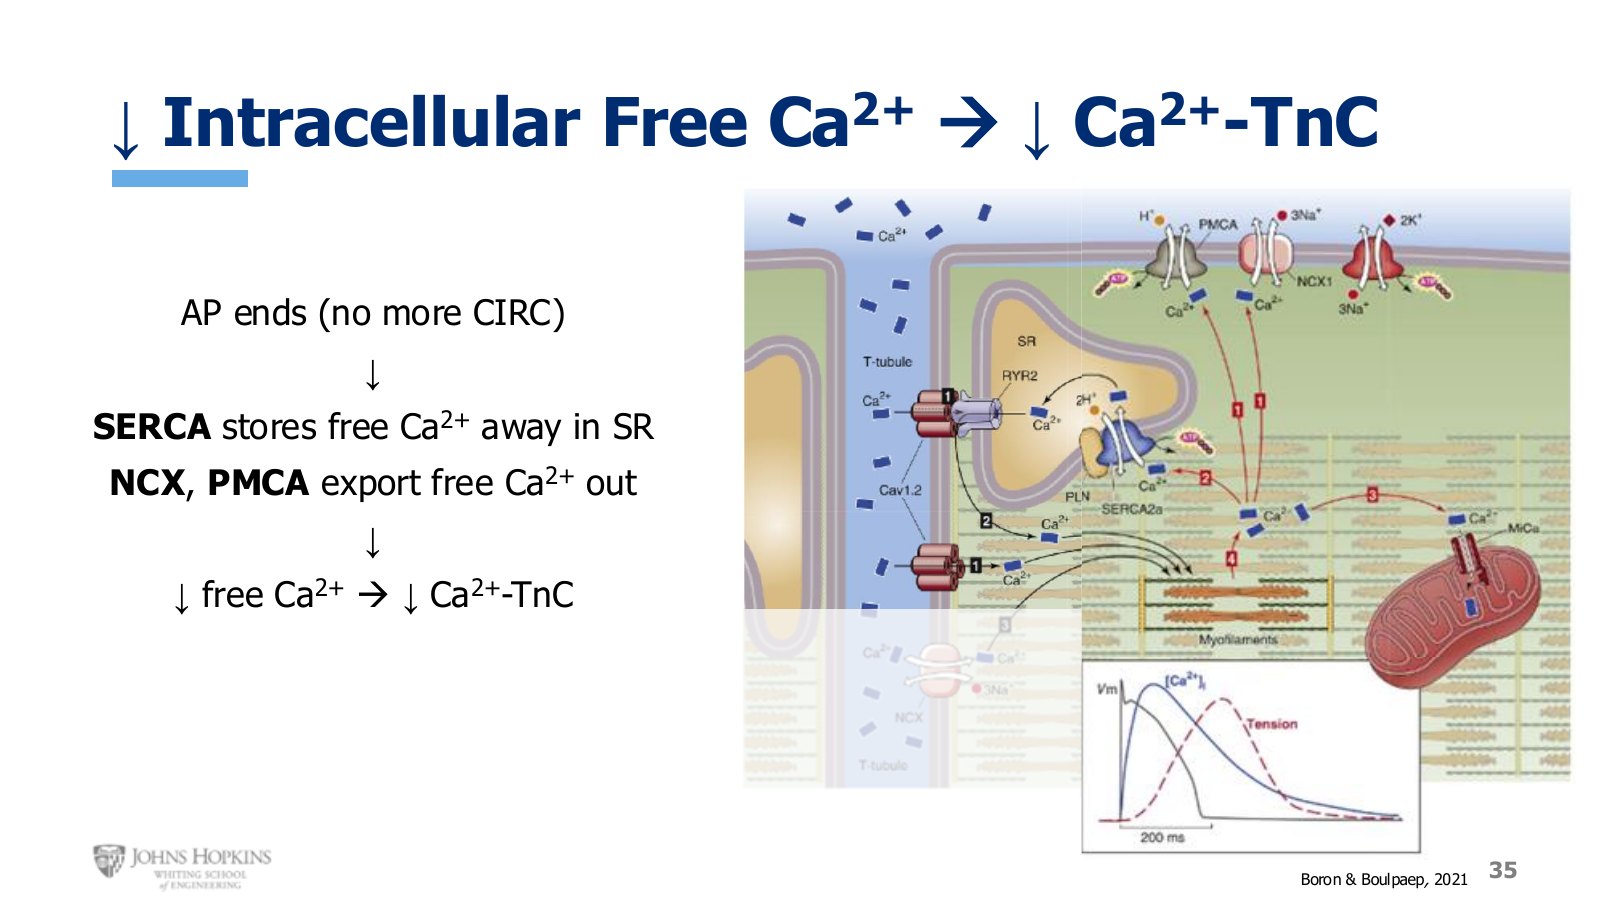
Slide 35. Three exits for calcium, with SERCA doing most of the work.
Once the action potential ends there is no more stimulus, and the cell focuses on clearing calcium three ways.
Where the calcium goes
Route | Destination | Share |
|---|---|---|
SERCA pump | Back into the sarcoplasmic reticulum | ~70% |
Sodium-calcium exchanger | Out into extracellular fluid | ~28% |
Plasma membrane calcium ATPase | Out into extracellular fluid | ~2% |
A small portion of free calcium also goes into the mitochondria to help with ATP production. If lots of ATP is being spent in the sarcomeres, enough has to be produced in the mitochondria to sustain contractile activity.
Relaxation
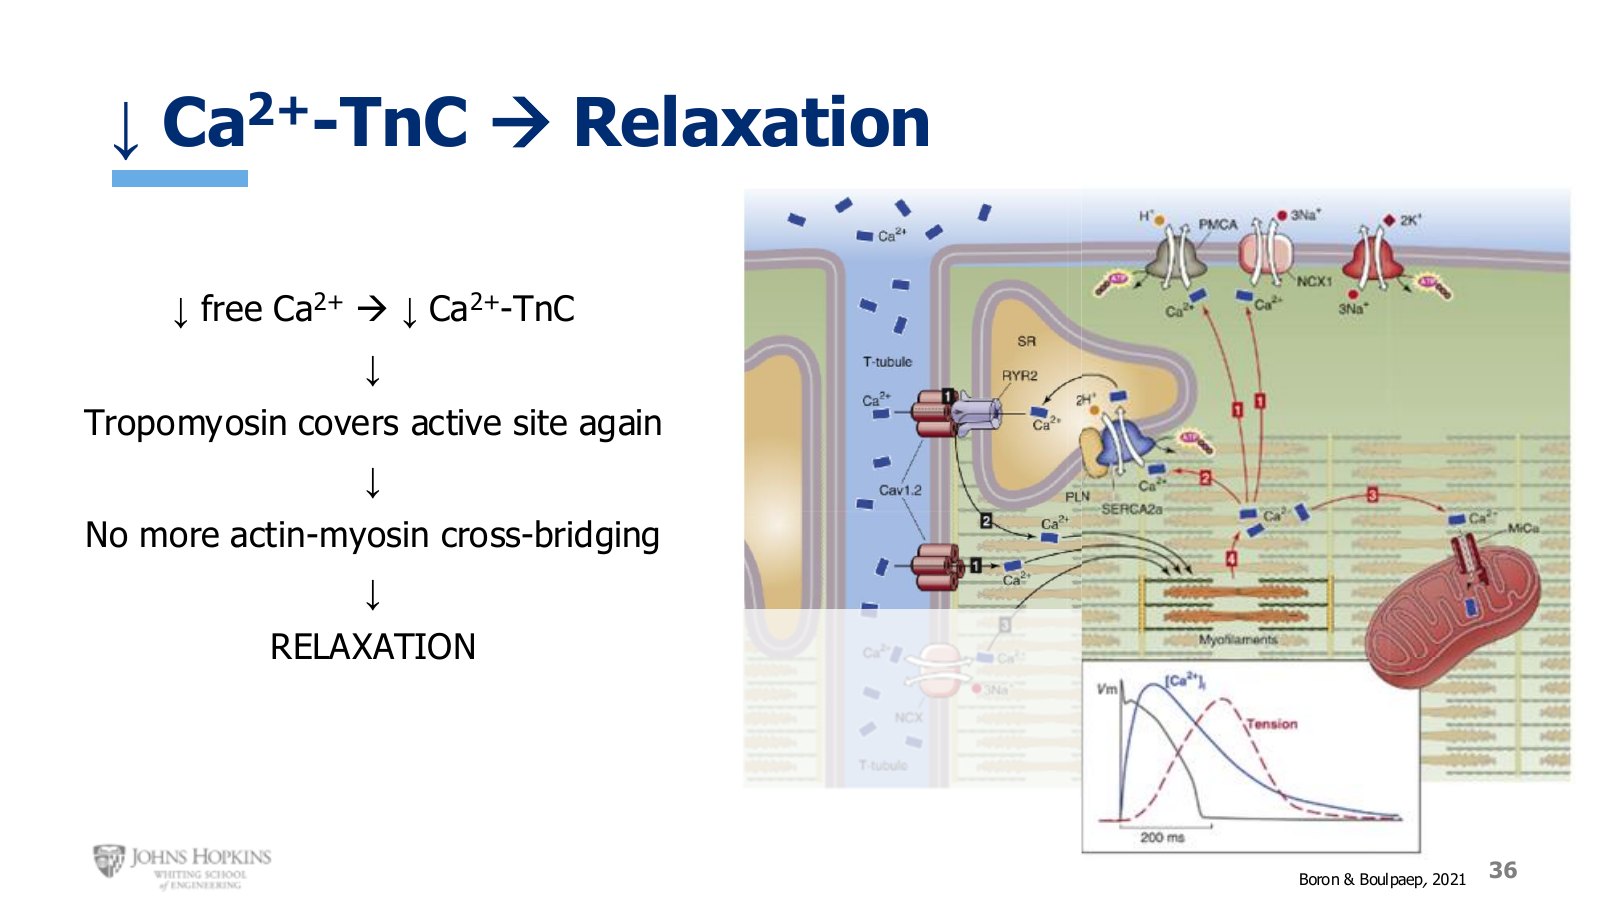
Slide 36. Tropomyosin rolls back over the binding site. Relaxation is the default state.
As calcium bound to troponin C keeps falling, tropomyosin rolls back onto actin’s binding site, covering it and preventing further cross-bridging. No cross-bridges, no power strokes, no contraction. In cardiac muscle, as in skeletal muscle, relaxation is the default condition when no contraction is occurring.
The Frank-Starling law
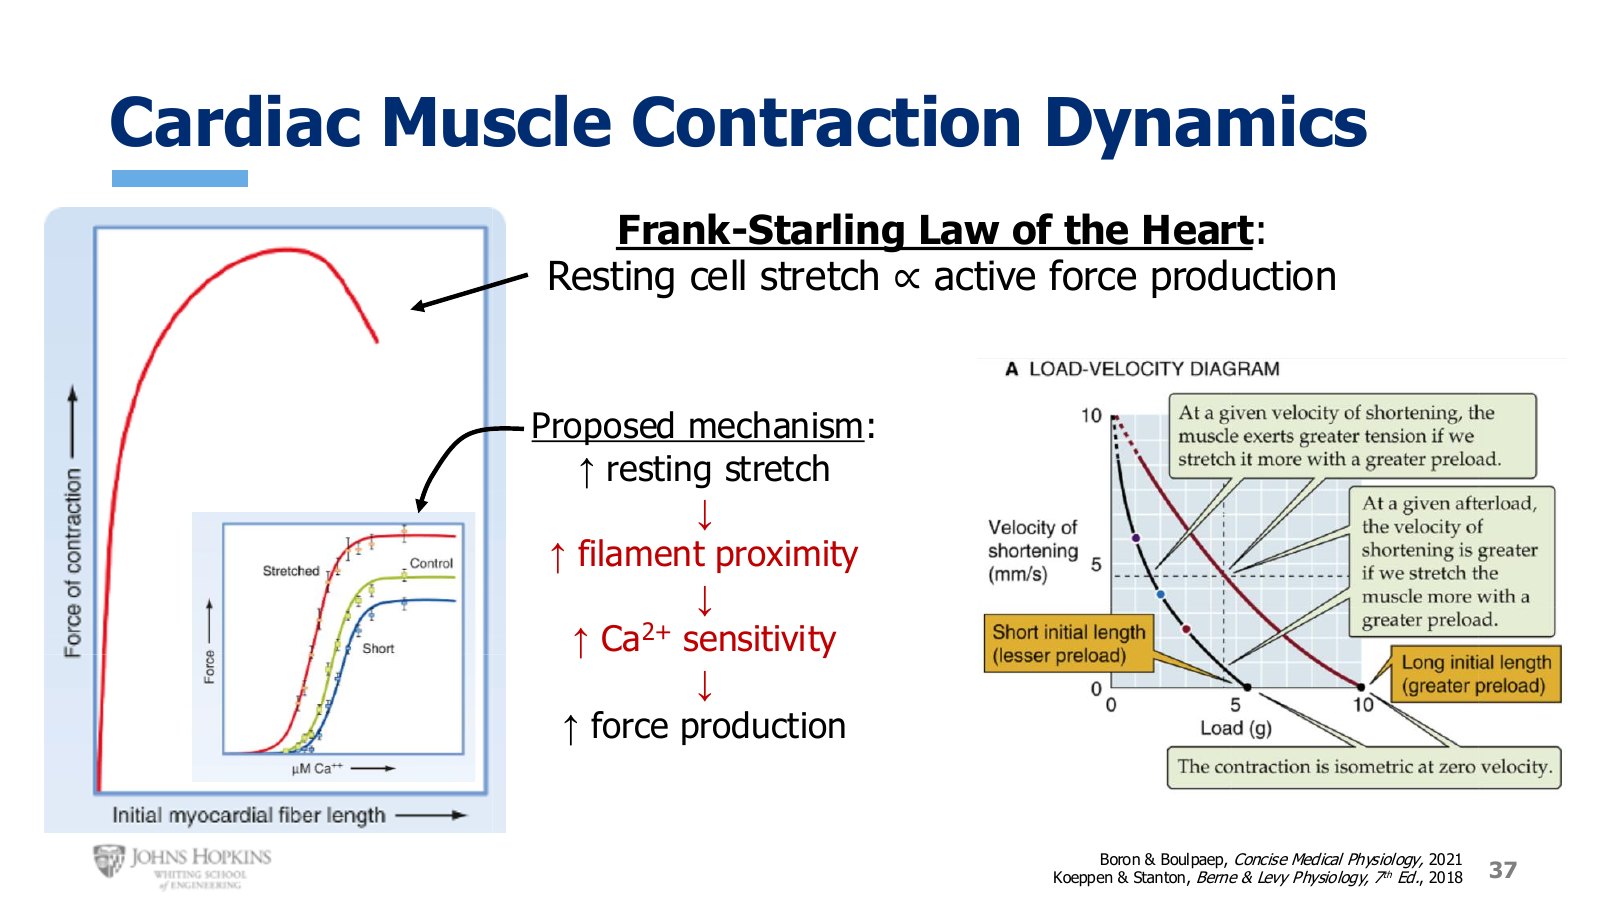
Slide 37. Length-tension for cardiac muscle, with the calcium sensitivity curves that appear to explain it.
Cardiac muscle has a length-tension curve with the same overall shape as the other two tissues. As resting cell length increases up to a point, contractile force increases with it. Beyond the optimum, which does not happen under normal healthy physiological conditions, active tension would decrease again.
This relationship is so vital to understanding how the heart pumps that it has its own name: the Frank-Starling law of the heart, after Otto Frank and Ernest Starling, two cardiovascular researchers who independently articulated it over a hundred years ago, long before anyone knew about the sliding filament theory.
The inset graph plots intracellular calcium against force production as a sigmoid: low calcium gives low force, a sensitive sweet spot in the middle gives a rapid rise, and a saturation point beyond which more calcium adds nothing. Three curves appear, one for baseline resting stretch, one for very little stretch, and one for much greater stretch. More stretch shifts the curve up and to the left, so a given calcium concentration produces much higher force. Less stretch shifts it down and to the right.
Force-velocity in cardiac muscle
The overall profile matches skeletal and smooth muscle, but what shifts the curve is different. Skeletal muscle shifted on fiber type, smooth muscle on degree of myosin phosphorylation. Cardiac muscle shifts on degree of stretch, also called preload, a heart-specific term developed in a few weeks.
At a given shortening velocity, the more stretched muscle produces higher force. At a given load and force, the more stretched muscle has higher shortening velocity. The heart has a distinct pumping advantage when it can generate more force more quickly, so within normal physiological limits, more stretch leads to better heart performance.