4G · Summary: Muscle Tissue Comparisons and Contrasts
Under the microscope
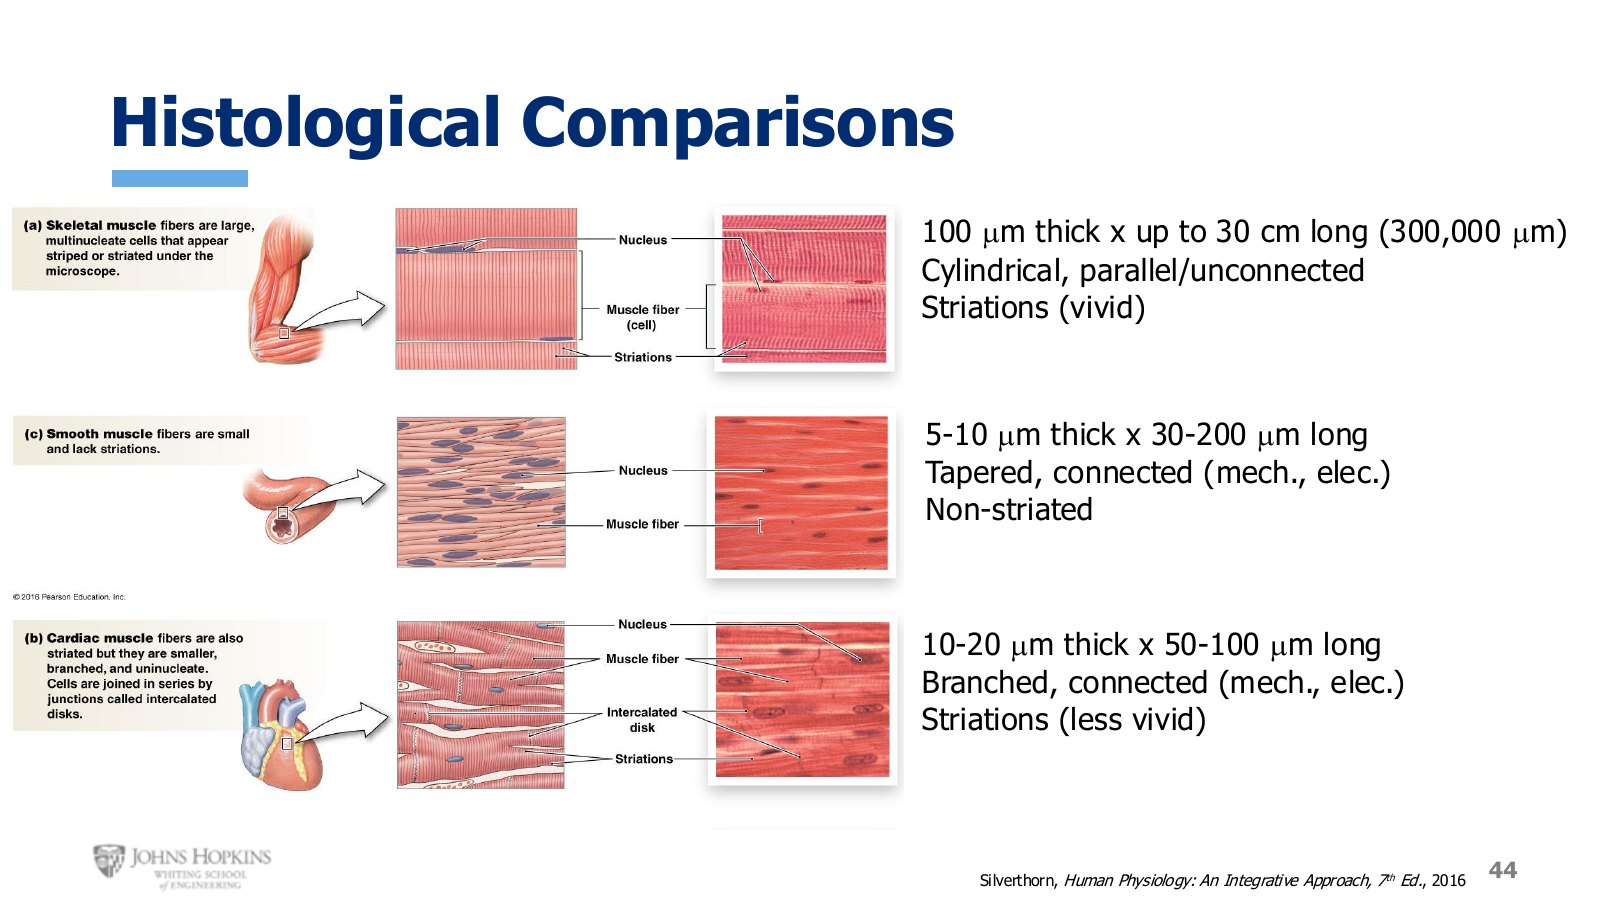
Slide 44. The three tissues at the same scale, with size, shape, connection, and striation for each.
Histological comparison
Tissue | Thickness | Length | Shape and connection | Striations |
|---|---|---|---|---|
Skeletal | ~100 µm | up to 30 cm (300,000 µm) | Cylindrical, parallel, uncoupled | Vivid |
Cardiac | 10–20 µm | 50–100 µm | Branched, coupled mechanically and electrically | Less vivid |
Smooth | 5–10 µm | 30–200 µm | Tapered, coupled mechanically and electrically | None |
Skeletal muscle cells run parallel to each other bundled in a fascicle but are not coupled, operating independently. Visible striations indicate a regular repeating sarcomere organization inside the cell, which is why smooth muscle has none and cardiac muscle has thin ones.
Twitch duration
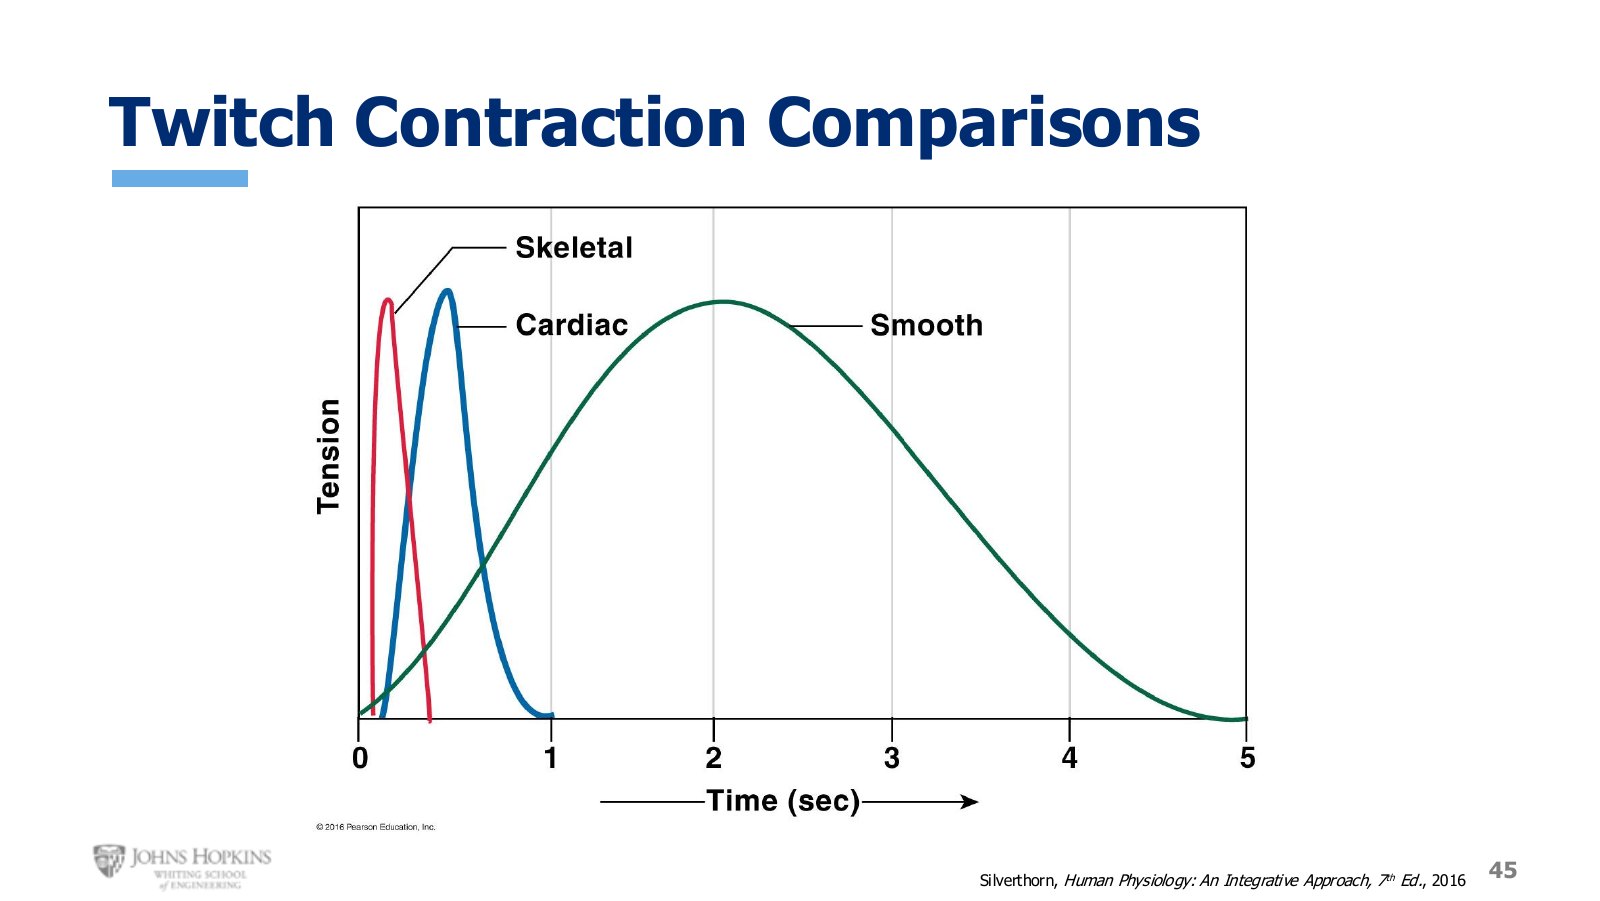
Slide 45. Three twitches on their real timescales. The units change from milliseconds to seconds.
Skeletal: 10 to 100 ms, depending on fast or slow twitch fiber.
Cardiac: around 400 ms at rest.
Smooth: around five full seconds to contract and relax again.
These differences suit their uses. Skeletal muscle needs to contract lightning fast for life-saving reflexes. Smooth muscle is not expected to respond fast and often needs to stay contracted for long periods, so it can afford a very slow twitch. Cardiac muscle in the middle can manipulate the duration of both the contractile and relaxation phases depending on heart rate.
Everything else
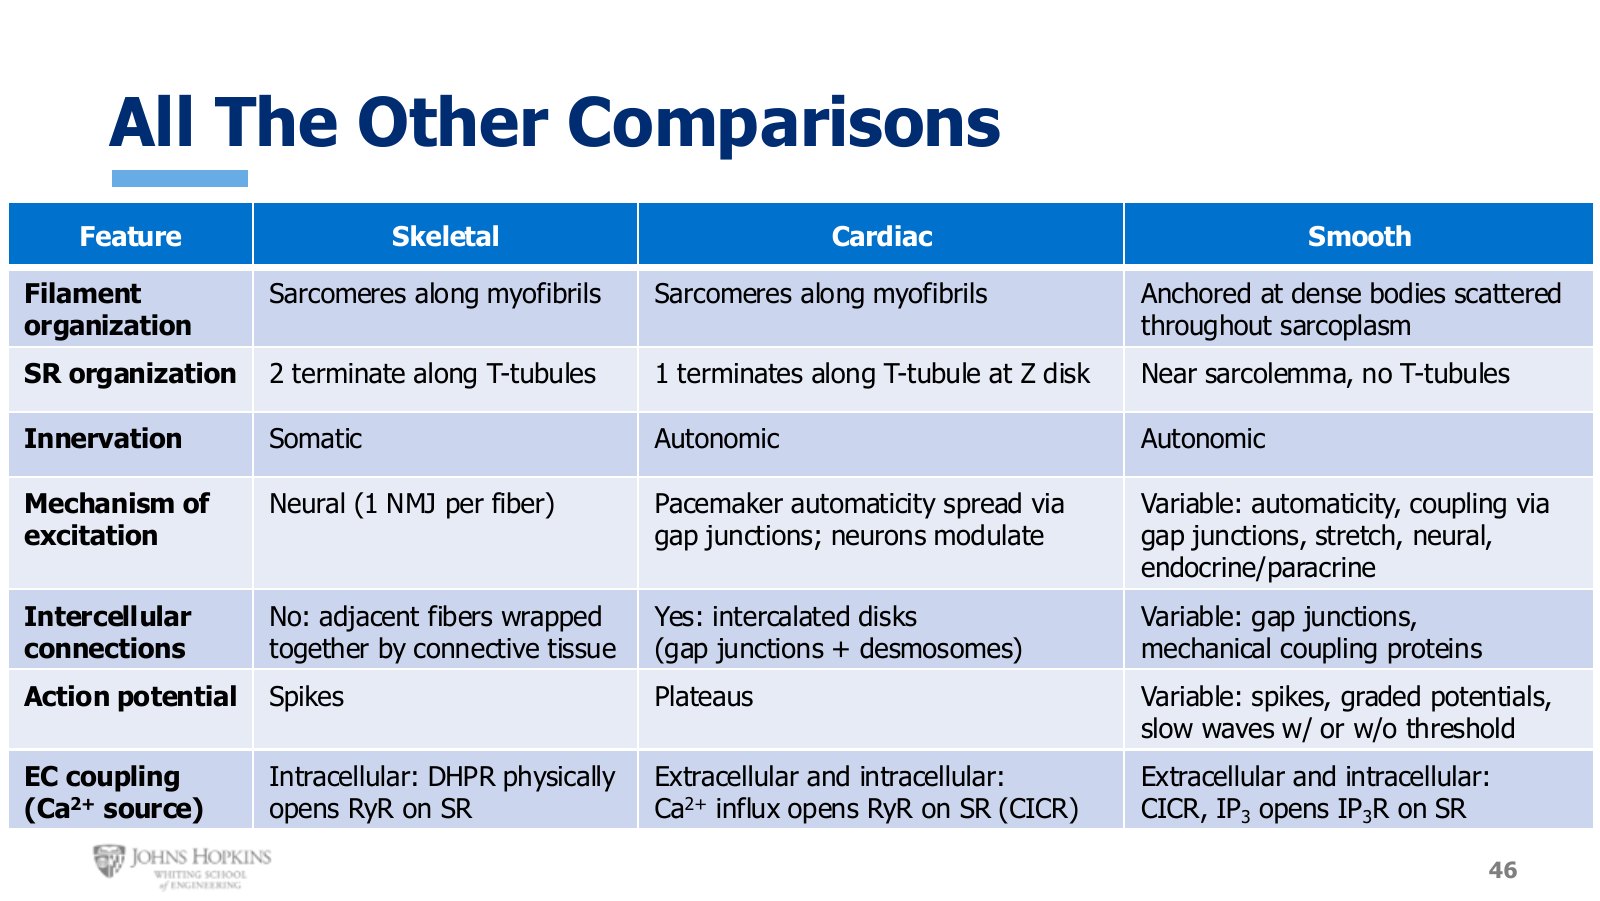
Slide 46. Skeletal on the left, smooth on the right, cardiac in the middle because it borrows from both.
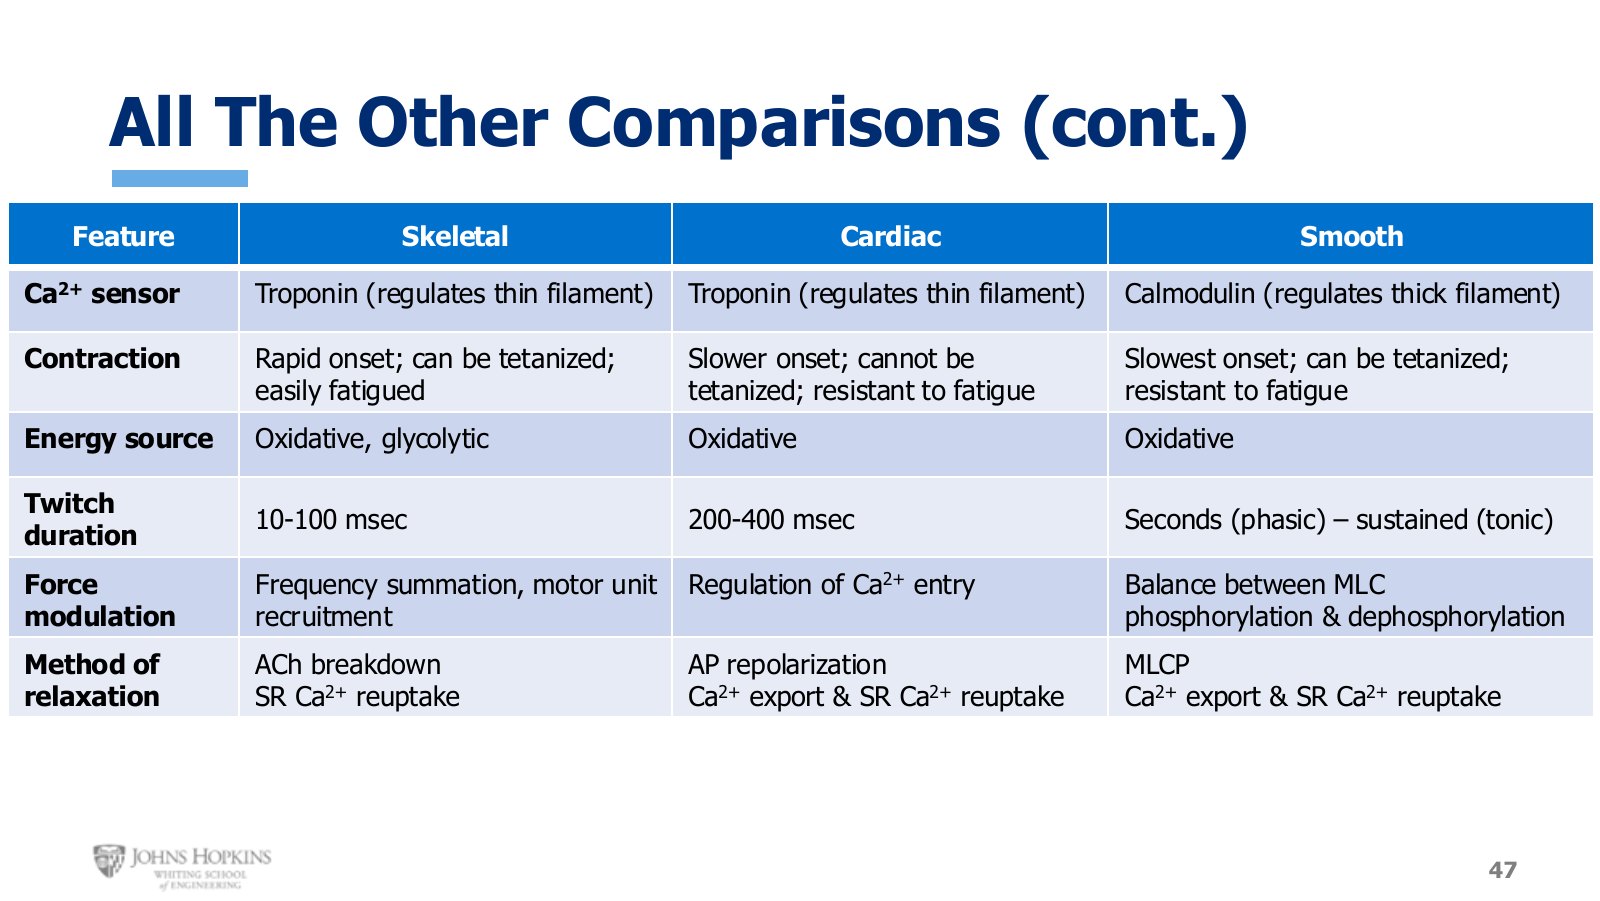
Slide 47. The second page, including the two rows worth reading closely: contraction and energy source.
Skeletal muscle sits on the left of the chart and smooth muscle on the opposite end at the right, because smooth muscle is about as opposite from skeletal as it gets. Cardiac muscle sits in the middle, sharing some characteristics with each.
Two rows deserve explicit attention, because they were alluded to throughout the module without ever being stated outright.
Contraction and energy source
Tissue | Contraction | Energy source |
|---|---|---|
Skeletal | Rapid onset. Can be tetanized through wave summation if stimulation frequency is high enough. Relatively easily fatigued, especially Type II fibers. | Oxidative and glycolytic |
Cardiac | Slower onset. Cannot be tetanized. Resistant to fatigue. | Oxidative, almost exclusively |
Smooth | Slowest onset. Can be tetanized if action potentials come often enough. Resistant to fatigue. | Oxidative, almost exclusively |